 2015, Vol. 58


1 引言
腾冲火山区位于喜马拉雅东构造结的东南部,由于印度板块的东向俯冲作用(Yin,2000; Lei et al., 2009,2013,2014; Li et al., 2008;胥颐等,2012),区内构造运动强烈,长期以来为众多研究学者所关注(王椿镛等,2002;姜朝松等,2004;赵慈平等,2006; Lei et al., 2009,2013,2014;胥颐等,2012).自上新世以来,腾冲火山区发生了不同期次的火山喷发活动(皇甫岗,1997;李大明等,2000),至今仍有许多温度高达90 ℃以上的热泉.不同的研究结果表明,腾冲火山区依然存在岩浆活动(白登海等,1994;王椿镛等,2002;叶建庆等,2003).Lei等(2009)使用近震和远震到时资料,获得深至地幔转换带的高分辨率速度模型,结果显示出腾冲火山下方存在深至400 km的低波速异常,而在地幔转换 带内却存在明显高波速异常,可能暗示腾冲火山的形成与印度板块东向俯冲引起的地幔热物质上涌有关.
由于印度板块的俯冲作用,腾冲火山区是我国大陆内部地震活动最强烈的地区之一.近年来,该区中小地震活动频繁,且部分中等地震呈现出双震型的发震特点.所谓双震型地震,是指某地区短期内(时间不超过该地区某类地震复发间隔的1/10)接连发生两次属于同类震级档次且构造上相关的地震,造成的震害分布互有重叠或接近(周瑞琦等,1998).如此定义的双震型地震在本研究区内的典型例子有1976年龙陵7.3级和7.4级地震以及2011年6月20日和8月9日腾冲地区发生的两个5.2级地震(图 1a).由于龙陵双震发生时在云南记录到的地震台站数量非常有限,因此难以较好地研究龙陵双震.然而,随着中国数字化固定地震台站的迅速发展,在云南地区已分布有大量数字化地震台站.与此同时,在腾冲双震发生期间的2010—2011年间中国地震局地壳应力研究所在云南地区布设了21个流动地震观测(Lei et al., 2012a,2014),有效地补充了腾冲火山区固定地震台站分布的稀疏性(图 1).这些固定与流动地震台站,均记录到了腾冲MS5.2级双震及伴随的大量余震(图 1a),为研究本次腾冲双震型地震提供了极有利条件,也对我们认识龙陵双震的发震机理具有重要参考价值.因此,本研究拟通过小震重定位及全矩张量反演,对腾冲5.2级双震的发震机理进行深入探讨,试图揭示该双震的发生是否与腾冲火山下方的岩浆作用有关.
 | 图 1 (a)固定台站(黑色三角)和流动台站(蓝色三角)及2011年腾冲双震(红色星号)和1976年龙陵双震(白色星号)分布 标注有代号的台站为gCAP反演所用到台站,红色三角代表腾冲火山所在位置;(b)P波和S波时距曲线, 红色点为本研究拾取流动台站资料;(c)本研究所用一维P波(实线)和S波(虚线)速度模型. Fig.1 (a)Distribution of the permanent(black triangles) and temporary(blue triangles)seismic stations and the 2011 Tengchong(red stars) and 1976 Longling(white stars)double earthquakes The stations with labeling are used in gCAP inversion process;(b)Time distance curves of the P and S waves. The red dots represent the picked data in the present study;(c)The 1-D VP(solid line) and VS(dashed line)velocity models used in this study. |
本研究收集腾冲火山区2010年6月至2013年6月由云南省固定台网记录的M>2.5级地震波形资料(郑秀芬等,2009),同时收集该时间段的观测震相资料.固定台站在腾冲及邻区分布较为稀疏,特别在腾冲火山区的西北方向只有一个台站(图 1a).为此,中国地震局地壳应力研究所于2010年5月至2011年7月在滇西地区布设了21个流动台站(Lei et al., 2012a,2014),填补了固定台站的空白区域,其中在腾冲火山区的西端布设有3个流动台站,较好地改善了研究区的台站方位覆盖(图 1a).
本研究联合使用观测震相到时资料和波形互相关数据,采用双差法(Waldhauser and Ellsworth, 2000)对5.2级双震及其1734个地震序列进行重定位.震相到时数据包括固定台站观测报告资料及流动台站本研究拾取资料,选择震中距在220 km内、每个事件至少有3个台站记录的到时(图 1b).其中,P波到时资料数为12207条,S波到时资料数为12477条,P波和S波权重分别设为1.0和0.5.重定位所用一维速度模型(图 1c)综合了人工测深和地壳速度成像后获得(秦嘉政等,2000;Wang and Huangfu, 2004; 杨晓涛等,2011).
波形互相关数据采用BCSEIS方法(Du et al.,2004)提取.该方法在三阶谱域计算时间延迟,以有效压制高斯相关噪声的影响.在计算过程中,使用双谱法(Bispectrum method)同时计算原始和滤波后两种波形的时间延迟,并用这两个时间延迟来验证互相关方法(Cross-correlation method)计算滤波后波形时间延迟的可靠性.本研究互相关计算选择M>2.5级共49个地震事件,考虑不同频段对结果的影响,选择滤波范围为1~8 Hz,P波窗口为P波初至前0.6 s和后1.5 s,S波窗口为S波初至前1 s和后2 s,最终获得P波相对到时4809对,S波相对到时2876对.
为详细探讨5.2级双震的发震模式,我们采用gCAP(generalized Cut and Paste)方法(Zhu and Ben-Zion, 2013)求取两次地震的全矩张量解(Mij). 该方法是在CAP 方法(Zhu and Helmberger, 1996)的基础上,在波形反演过程中包含了非双力偶分量,通过对Pnl和S波(或面波)两部分赋予不同权重,计算理论和实际波形的拟合误差函数,采用网格搜索得到最小误差的最优解.反演中,Pnl和S 波滤波范围分别为0.05~0.2 Hz和0.02~0.1 Hz,走向、倾角和滑动角的搜索间隔均为6°,深度为1 km. 格林函数采用频率-波数法(FK)计算(Zhu and Rivera, 2002),采样间隔设为0.1 s,采样点1024个.
为定量表达Mij中非双力偶成分的大小,需要对Mij进行分解.采用较为通用的分解方式(Julian et al., 1998),即将Mij分解为双力偶(Double Couple,DC)、 各向同性(Isotropic,ISO)和补偿线性偶极子(Compensated Linear Vector Dipole,CLVD)三部分.首先将Mij分解为ISO和偏张量(Dij)两部分:
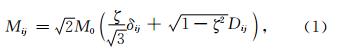
 表示ISO的大小,δij为克罗内克函数,

通过双差重定位,我们获得1677个地震事件的重定位结果,其东西、南北及深度上平均相对误差分别为14 m、14 m和28 m.由于所有地震几乎均处在同一丛集中,因此反演结果相对误差均很小.从重定位地震平面分布可以看出(图 2a),地震位于龙川江断裂的西侧,且呈现窝状分布;穿过腾冲火山区的剖面结果显示(图 2b),5.2级双震的震源深度很接近,分布在7~8 km之间,而余震序列的优势深度主要集中在2~12 km之间;另外一个显著的特点为,地震序列在深度上表现为一个倾斜的柱状体,且倾向腾冲火山区.这样的空间分布特征可能表明,5.2级双震的孕震环境与腾冲火山区下方岩浆热物质作用密切相关.为更清晰地了解岩浆作用的物理过程,我们对震源模型不作先验假定来求取5.2级双震的全矩张量解.
 | 图 2(a)重定位地震(圆圈)平面分布;(b)地震在剖面A-B上的投影 黑色三角为腾冲火山,双星号代表2011年腾冲双震. Fig. 2(a)Relocated earthquakes(circles)in map view;(b)Vertical cross section of the earthquakes along the profile A-B The black triangle denotes the Tengchong volcano,the double stars denote the 2011 Tengchong double earthquakes. |
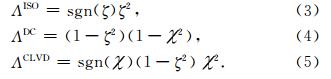
通过不同深度地震矩张量反演,得到两次地震的最佳矩心深度分别为7 km和8 km(图 3),与重定位震源深度具有较好的一致性.图 4展示了2011年6月20日5.2级地震全矩张量解(下半球投影)以及理论和实际波形拟合图,其中波形段总共54个,相关系数在70%以上有39个,占总数的72%,说明整体上波形的拟合效果较好.该地震反演得到的矩震级(Mw)为5.0级,与此同时8月9日地震的矩震级也被确定为5.0级.表 1给出两次5.2级地震(事件编号为3号和6号)ζ和的具体值,以及ISO、CLVD和DC三部分所占的百分比.从表 1可以看出,6月20日5.2级地震具有显著的非双力偶成分(ISO和CLVD),百分比达到10.7%;而8月9 日5.2级地震的非双力偶成分相对较小,仅占0.7%,更接近于双力偶型破裂机制.为了直观展示震源破裂机制,我们将地震投影到震源类型图上(图 5),与Hudson等(1989)的震源类型图相似,ΛISO的变化 范围为-1到+1,ΛISO=+1表示外向爆炸源(+ISO),而ΛISO=-1表示内向闭合源(-ISO);同样,ΛCLVD的变化范围为-0.25到+0.25,ΛCLVD=+0.25表示极性向外的+CLVD机制,而ΛCLVD=-0.25则极性相反.以上结果表明,6月20日5.2级地震与典型的构造地震不同,其包含明显的非双力偶成分,而8月9日5.2级地震非双力偶成分非常小,几乎 为双力偶型破裂机制.地震全矩张量中包含非双力偶成分,表明震源破裂过程较为复杂,而这种非双力偶成分是由于反演过程中不确定因素造成,还是震源破裂过程的真实反映,这需要我们开展结果的可靠性验证.
 | 图 3 2011年6月20日和8月9日双震不同深度矩张量解及其拟合残差 Fig. 3 The moment tensor solutions and their RMS of the 20 June and 9 August 2011 double earthquakes at different depths |
 | 图 4 2011年6月20日MS5.2(Mw5.0)地震矩张量解及理论(红色)和实际(黑色)波形对比图
波形下方数字表示理论相对实际波形的相对移动时间和二者的相关系数;左侧大写字母表示台站名,其下方数字为震中距(km)和相对偏移时间(s). Fig. 4 The moment tensor solution and the comparison between synthetic(red) and observed(black)waveforms of the MS5.2(Mw5.0)20 June 2011 earthquake The numbers below each traces are relative time shift and cross-correlation coefficient; The station names are given on the left,the numbers below which are epicentral distance(in km) and relative time shift(in sec). |
 | 图 5 M>3.5地震震源类型图 等值线代表DC所占百分比,圆圈数字为表 1中事件的代号. Fig. 5 Source type plot of the M>3.5 earthquakes The contours show DC percent, and the numbers in the circle are the event numbers in Table 1. |
|
|
表 1 M>3.5级地震ISO、CLVD和DC所占百分比 Table 1 The percentage of ISO,CLVD and DC in the M>3.5 earthquakes |
本研究采用Bootstrap方法(Efron,1979)对反演参数进行可靠性验证.该方法基于重抽样思想,从样本中随机抽样得到新的子样本,并对新的子样本进行计算,重复n次得到n组反演参数,对反演参数进行统计分析,评价反演结果的稳定性及可靠性.一般地说,采样次数取约100次就可对反演参数进行 较为合理的评估(Efron and Tibshirani, 1986).这种用于验证结果可靠性的方法在速度模型、Q值和震源参数反演方面均有较好的应用(如Wang et al., 2003b; 裴顺平等,2010; 陈伟文等,2012).为更具有统计意义和更能说明结果的可靠性,本研究设置采样次数为200次,设置重抽样台站个数与每个地震事件实际反演台站个数相同,这样会有部分台站被重复采样,对每次采样的台站进行波形反演,最终得到参数ζ和的分布图(图 6).从图 6可以看出,6月20日5.2级地震(表 1事件3)的计算参数ζ(-0.23)和(0.24)分别落在各自的95%置信区间[-0.27,-0.23]和[0.22,0.25]内,8月9日5.2级地震(表 1事件6)的ζ(-0.07)和(-0.04)也分别落在各自95%置信区间[-0.04,-0.08]和[-0.02,-0.04]内;另外,事件3和事件6的ζ和分布较为集中,且事件3的参数ζ和事件6的参数 分别近似地呈现出以各自计算值为中心的正态分布.同时,我们进一步给出走向、倾角及滑动角的统计结果,并将实际反演获得参数在直方图上用箭头标记(图 6),可以看出子样本反演得到的震源参数均较为集中,表明我们的反演结果很稳定.
 | 图 6 Bootstrap法分别对6月20日和8月9日5.2级地震重抽样得到参数ζ和χ及震源参数(走向,倾角,滑动角)分布直方图 箭头表示实际反演得到的参数值. Fig. 6 Distribution histograms of the ζ,χ and source parameters(strike,dip,rake)related to the 20 June and 9 August MS5.2 earthquakes with Bootstrap method The arrows indicate the values of inversion parameters. |
本研究结果显示6月20日5.2级地震的全矩张量解中包含有明显的非双力偶成分,表明这次震源的破裂过程较为复杂.这种复杂性可能与地震所处的构造环境有一定相关性,但也许还有其他方面的原因.这里,仅列出3个我们认为较为重要的原因.第一方面的原因是多重震源破裂的叠加效应(Julian et al., 1998),比如在时间和空间上非常靠近的两次或多次事件却误将其解释为一次事件,这样的事件在俯冲带深源地带和洋中脊转换带等区域广泛存在(Frohlich,1995; 李圣强等,2013).第二方面的原因是震源破裂面为非平面结构(Julian et al., 1998; Vavryuk,2002),如地震发生在共轭型断裂的交汇区域(Lei et al., 2012a; 张广伟等,2014).第三方面的原因是震源区高孔隙流体压力导致的拉张或闭合型破裂,这样的破裂机制在火山区和高地热区被大量观测到(Miller et al., 1998; Foulger et al. 2004; Lei et al., 2012b).
前人研究结果表明,腾冲火山区具有高热流、低电阻率、低Q值和低波速特征(秦嘉政等,1998;王椿镛等,2002;胡家富等,2003; Lei et al., 2009; 胥颐等,2012).在腾冲火山区下方存在的低速异常体可能是地幔热物质上涌,并通过断裂等狭窄通道进入上地壳后发生岩浆分异作用形成的岩浆囊(Wang et al., 2003a; Lei et al., 2009; 胥颐等,2012; 孙长青等,2013).相对地热梯度研究结果显示,腾冲火山区存在三个岩浆囊,其中第一个岩浆囊 位于腾冲热海区域,活动性最强(赵慈平等, 2006,2012),此次5.2级双震即位于该岩浆囊的东南向边缘;人工地震测深结果表明,在腾冲东南部存在岩浆囊或部分熔融体(楼海等,2002);对腾冲火山区震群研究结果表明,地震主要围绕在岩浆囊体的周围,与岩浆活动密切相关(叶建庆等,2003);远震Pms震相的各向异性研究结果显示,围绕腾冲火山区各向异性快波方向呈现为发散状,可能是由于地幔深处的热物质上升至下地壳、经上地壳阻挡然后在下地壳延展的原因(孙长青等,2013);区域应力场研究 结果显示腾冲火山区最大主压应力近垂直,可能与岩 浆囊导致的局部水平拉张有关(Zhao et al., 2013).
本研究全矩张量结果揭示,6月20日5.2级地震为体积缩小的内向闭合型破裂,具有明显的非双力偶成分(表 1和图 4).这样的震源破裂特征是否在其他地震中也有所体现,为此我们进一步求得6月20日前后M>3.5地震的全矩张量解,其具体参数列于表 2.由表 1可以看出,5月31日发生一个震级较大地震(M4.7),其非双力偶分量仅占0.1%,为双力偶型地震;至6月14日发生的M3.7级地震,其非双力偶成分有所增加,但仅占0.8%;而到6月20日发生的MS5.2级地震,则包含明显的非双力偶分量,占10.7%,并且紧随其后发生的M3.6级地震(表 1中的事件4)也表现出一定的非双力偶成分,占到7%;6月25日以后发生的地震(表 1中的事件5、7和8)非双力偶成分显著减小,与8月9日MS5.2级地震相似,更接近于双力偶型地震.这些结果表明,6月20日前的地震活动(图 7)可能引起岩浆囊内岩浆作用于龙川江断层、导致断层内流体增多填充裂隙从而降低断层面上有效正应力(Lei and Zhao, 2009),从而触发了6月20日MS5.2级 地震.由于本次地震震源破裂过程为体积缩小的闭合型破裂,再加上同日M3.6级地震(表 1中事件4)也为闭合型地震,因而震源体内裂隙中的流体可能被挤出,致使在其附近又诱发了8月9日MS5.2级地震.因此,我们认为双震型地震的发生,与前次地震为体积缩小的闭合型破裂密切相关.两次5.2级地震后,均导致大量余震发生(图 7),且这些余震在较 小范围内由主震处向浅部迁移,可能暗示断层为岩浆活动提供了通道,这也得到余震活动呈现为一个随深度倾斜于腾冲火山区(图 2)结果的支持.
|
|
表 2 表 1中M>3.5级地震全矩张量解 Table 2 Full moment tensor solutions of the M>3.5 earthquakes in Table 1 |
 | 图 7 2011腾冲双震的震级-时间序列图 Fig. 7 Magnitude-time sequence diagram of the 2011 Tengchong double earthquakes |
| [1] | Bai D H, Liao Z J, Zhao G Z, et al. 1994. The inference of magmatic heat source beneath the Rehai (Hot Sea) field of Tengchong from the result of magnetotelluric sounding. Chinese Science Bulletin, 39(7):572-577. |
| [2] | Chapman C H, Leaney W S. 2012. A new moment-tensor decomposition for seismic events in anisotropic media. Geophys. J. Int., 188(1):343-370. |
| [3] | Chen W W, Ni S D, Wang Z J, et al. 2012. Joint inversion with both local and teleseismic waveforms for source parameters of the 2010 Kaohsiung earthquake. Chinese J. Geophys. (in Chinese), 55(7):2319-2328, doi:10.6038/j.issn.0001-5738.2012.07.017. |
| [4] | Du W X, Thurber C H, Eberhart-Phillips D. 2004. Earthquake relocation using cross-correlation time delay estimates verified with the bispectrum method. Bull. Seism. Soc. Am., 94(3):856-866. |
| [5] | Efron B. 1979. Bootstrap methodsanother look at the jackknife. Ann. Stat., 7:1-26. |
| [6] | Efron B, Tibshirani R. 1986. Bootstrap methods for standard errors, confidence intervals, and other measures of statistical accuracy. Statistical Science, 54-75. |
| [7] | Foulger G R, Julian B R, Hill D P, et al. 2004. Non-double-couple microearthquakes at Long Valley caldera, California, provide evidence for hydraulic fracturing. Journal of Volcanology and Geothermal Research,132(1):45-71. |
| [8] | Frohlich C. 1995. Characteristics of well-determined non-double-couple earthquakes in the Harvard CMT catalog. Phys. Earth Planet. Inter., 91(4):213-228. |
| [9] | Hu J F, Cong L L, Su Y J, et al. 2003. Distribution characteristics of Q value of the Lg coda in Yunnan and its adjacent region. Chinese J. Geophys. (in Chinese), 46(6):809-813. |
| [10] | Huangfu G. 1997. Review of studies on Tengchong volcanoes. Journal of Seismological Research(in Chinese), 20(4):431-437. |
| [11] | Hudson J A, Pearce R G, Rogers R M. 1989. Source type plot for inversion of the moment tensor. J. Geophys. Res., 94:765-774. |
| [12] | Jiang C S, Zhou Z H, Zhao C P. 2004. The structur characteristics of the crust and upper mantle in the area of Tengchong volcano. Journal of Seismological Research(in Chinese), 27(Suppl.):1-6. |
| [13] | Julian B R, Miller A D, Foulger G R. 1998. Non-double-couple earthquakes theory. Reviews of Geophysics, 36(4):525-549. |
| [14] | Lei J S, Xie F R, Fan Q C, et al. 2013. Seismic imaging of the deep structure under the Chinese volcanoes:An overview. Phys. Earth Planet. Inter., 224:104-123, doi:10.1016/j.pepi.2013.08.008. |
| [15] | Lei J S, Zhao D P. 2009. Structural heterogeneity of the Longmenshan fault zone and the mechanism of the 2008 Wenchuan earthquake (Ms8.0). Geochem. Geophys. Geosyst., 10Q10010, doi:10.1029/2009GC002590. |
| [16] | Lei J S, Zhao D P, Su Y J. 2009. Insight into the origin of the Tengchong intraplate volcano and seismotectonics in southwest China from local and teleseismic data. J. Geophys. Res., 114:B05302. |
| [17] | Lei J S, Zhang G W, Xie F R, et al. 2012a. Relocation of the 10 March 2011 Yingjiang, China, earthquake sequence and its tectonic implications. Earthquake Science, 25:103-110. |
| [18] | Lei J S, Xie F R, Mishra O P,et al. 2012b. The 2011 Yingjiang, China, Earthquake:A volcano-related fluid-driven earthquake? Bull. Seismol. Soc. Am., 102(1):417-425. |
| [19] | Lei J S, Li Y, Xie F R, et al. 2014. Pn anisotropic tomography and dynamics under eastern Tibetan plateau. J. Geophys. Res., 119:2174-2198. |
| [20] | Li C, Van der Hilst R, Meltzer A, et al. 2008. Subduction of the Indian lithosphere beneath the Tibetan Plateau and Burma. Earth Planet. Sci. Lett., 274:157-168. |
| [21] | Li D M, Li Q, Chen W J. 2000. Volcanic activities in the Tengchong volcano area since Pliocene. Acta Petrologica Sinica(in Chinese), 16(3):362-370. |
| [22] | Li S Q, Chen Q F, Zhao L, et al. 2013. Anomalous focal mechanism of the May 2011 Mw5.7 deep earthquake in Northeastern China:regional waveform inversion and possible mechanism. Chinese J. Geophys. (in Chinese), 56(9):2959-2970. |
| [23] | Lou H, Wang C Y, Huang G, et al. 2002. Three-dimensional seismic velocity tomography of the upper crust in Tengchong volcanic area, Yunan province. Acta Seismologica Sinica(in Chinese), 24(3):243-251. |
| [24] | Miller A D, Foulger G R, Julian B R. 1998. Non-double-couple earthquakes observations. Reviews of Geophysics, 36(4):551-568. |
| [25] | Pei S P, Liu J, Ma H S, et al. 2010. Dynamic variation of S-wave Q value beneath Sichuan-Yunnan, China. Chinese J. Geophys. (in Chinese), 53(7):1639-1652. |
| [26] | Qin J Z, Huangfu G, Zhang J W. 1998. Characteristics of Q values around Tengchong volcano and adjacent areas. Journal of Seismological Research(in Chinese), 21(4):358-361. |
| [27] | Qin J Z, Huangfu G, Li Q, et al. 2000. 3-D chromatography of velocity structure in Tengchong volcano areas and nearby. Journal of Seismological Research(in Chinese), 23(2):157-165. |
| [28] | Sun C Q, Lei J S, Li C, et al. 2013. Crustal anisotropy beneath the Yunnan region and dynamic implications. Chinese J. Geophys. (in Chinese), 56(12):4095-4105. |
| [29] | Vavryuk V. 2002. Non-double-couple earthquake of 1997 January in West Bohemia, Czech Republic:evidence of tensile faulting. Geophys. J. Int., 149:364-373. |
| [30] | Waldhauser F, Ellsworth W L. 2000. A double-difference earthquake location algorithm:method and application to the Northern Hayward Fault, California. Bull. Seismol. Soc. Am., 90(6):1353-1368. |
| [31] | Wang C Y, Lou H, Wu J P, et al. 2002. Seismological study on the crustal structure of Tengchong volcano-geothermal area. Acta Seismologica Sinica(in Chinese), 24(3):231-242. |
| [32] | Wang C Y, Chan W W, Mooney W D. 2003a. Three-dimensional velocity structure of crust and upper mantle in southwestern China and its tectonic implications. J. Geophys. Res., 108(B9) 2442, doi:10.1029/2002JB001973. |
| [33] | Wang C Y, Huangfu G. 2004. Crustal structure in Tengchong Volcano-Geothermal Area, western Yunnan, China. Tectonophysics, 380:69-87. |
| [34] | Wang S Y, Xu Z H, Pei S P. 2003b. Velocity structure of uppermost mantle beneath North China from Pn tomography and its implications. Science in China Series D:Earth Sciences, 46(2):130-140. |
| [35] | Xu Y, Zhong D L, Liu J H. 2012. Constraints of deep structures on the crust-mantle decoupling in the western Yunnan and the magma activity in the Tengchong volcanic area. Progress in Geophysics(in Chinese), 27(3):846-855, doi:10.6038/j.issn.1004-2903.2012.03.003. |
| [36] | Yang X T, Xu Y, Liu J H, et al. 2011. Seismic tomography in the Tengchong volcanic area and its tectonic implication. Chinese J. Geophys. (in Chinese), 54(8):2050-2059. |
| [37] | Ye J Q, Cai S P, Liu X J, et al. 2003. Characteristics of earthquake cluster activity in Tengchong volcanic area. Seismology and Geology(in Chinese), 25(Suppl.):128-137. |
| [38] | Yin A. 2000. Mode of Cenozoic east-west extension in Tibet suggesting a common origin of rifts in Asia during the Indo-Asian collision. J. Geophys. Res., 105(B9):21745-21759. |
| [39] | Zhang G W, Lei J S, Liang S S, et al. 2014. Relocations and focal mechanism solutions of the 3 August 2014 Ludian, Yunnan Ms6.5 earthquake sequence. Chinese J. Geophys. (in Chinese), 57(9):3018-3027. |
| [40] | Zhao C P, Ran H, Chen K H. 2006. Present day magma chambers in Tengchong volcano area inferred from relative geothermal gradient. Acta Petrologica Sinica(in Chinese), 22(6):1517-1528. |
| [41] | Zhao C P, Ran H, Wang Y. 2012. Present-day mantle-derived helium release in the Tengchong volcanic field, Southwest China:implications for tectonics and magmatism. Acta Petrologica Sinica (in Chinese), 28(4):1189-1204. |
| [42] | Zhao L, Luo Y, Liu T Y, et al. 2013. Earthquake focal mechanisms in Yunnan and their inference on the regional stress field. Bull. Seism. Soc. Am., 103(4):2498-2507. |
| [43] | Zheng X F, Ou B, Zhang D N, et al. 2009. Technical system construction of Data Backup Centre for China Seismograph Network and the data support to researches on the Wenchuan earthquake. Chinese J. Geophys. (in Chinese), 52(5):1412-1417. |
| [44] | Zhou R Q, Guo S M, He W. 1998. A study on the rupturing model of the double-main shock in the Longlin-Lancang fault zone. Seismology and Geology(in Chinese), 20(3):261-268. |
| [45] | Zhu L P, Helmberger D V. 1996. Advancement in source estimation techniques using broadband regional seismograms. Bull. Seism. Soc. Am., 86(5):1634-1641. |
| [46] | Zhu L P, Rivera L A. 2002. A note on the dynamic and static displacements from a point source in multilayered media. Geophys. J. Int., 148(3):619-627. |
| [47] | Zhu L P, Ben-Zion Y. 2013. Parametrization of general seismic potency and moment tensors for source inversion of seismic waveform data. Geophys. J. Int., 194(2):839-843. |
| [48] | 白登海, 廖志杰, 赵国泽等. 1994. 从MT深结果推论腾冲热海热田的岩浆热源. 科学通报, 39(4): 344-347. |
| [49] | 陈伟文, 倪四道, 汪贞杰等. 2012. 2010年高雄地震震源参数的近远震波形联合反演. 地球物理学报, 55(7): 2319-2328. doi: 10.6038/j. issn.0001-5738.2012.07.017 |
| [50] | 胡家富, 丛连理, 苏有锦等. 2003. 云南及周边地区Lg尾波Q值的分布特征. 地球物理学报, 46(6): 809-813. |
| [51] | 皇甫岗. 1997. 腾冲火山研究综述. 地震研究, 20(4): 431-437. |
| [52] | 姜朝松, 周真恒, 赵慈平. 2004. 腾冲火山区地壳及上地幔结构特征. 地震研究, 27(增刊): 1-6. |
| [53] | 李大明, 李齐, 陈文寄. 2000. 腾冲火山区上新世以来的火山活动. 岩石学报, 16(3): 362-370. |
| [54] | 李圣强, 陈棋福, 赵里等. 2013. 2011年5月中国东北Mw5.7深震的非同寻常震源机制: 区域波形反演与成因探讨. 地球物理学报, 56(9): 2959-2970. |
| [55] | 楼海, 王椿镛, 皇甫岗等. 2002. 云南腾冲火山区上部地壳三维地震速度层析成像. 地震学报, 24(3): 243-251. |
| [56] | 裴顺平, 刘杰, 马宏生等. 2010. 川滇地区横波Q值动态变化. 地球物理学报, 53(7): 1639-1652. |
| [57] | 秦嘉政, 皇甫岗, 张俊伟. 1998. 腾冲火山及周围地区的地壳Q值特征. 地震研究, 21(4): 358-361. |
| [58] | 秦嘉政, 皇甫岗, 李强等. 2000. 腾冲火山及邻区速度结构的三维层析成象. 地震研究, 23(2): 157-165. |
| [59] | 孙长青, 雷建设, 李聪等. 2013. 云南地区地壳各向异性及其动力学意义. 地球物理学报, 56(12): 4095-4105. |
| [60] | 王椿镛, 楼海, 吴建平等. 2002. 腾冲火山地热区地壳结构的地震学研究. 地震学报, 24(3): 231-242. |
| [61] | 胥颐, 钟大赉, 刘建华. 2012. 滇西地区壳幔解耦与腾冲火山区岩浆活动的深部构造研究. 地球物理学进展, 27(3): 846-855, doi: 10.6038/j.issn.1004-2903.2012.03.003. |
| [62] | 杨晓涛, 胥颐, 刘建华等. 2011. 腾冲火山区的地震层析成像及其构造意义. 地球物理学报, 54(8): 2050-2059. |
| [63] | 叶建庆, 蔡绍平, 刘学军等. 2003. 腾冲火山地震群的活动特征. 地震地质, 25(增刊): 128-137. |
| [64] | 张广伟, 雷建设, 梁姗姗等. 2014. 2014年8月3日云南鲁甸Ms6.5级地震序列重定位与震源机制研究. 地球物理学报, 57(9): 3018-3027. |
| [65] | 赵慈平, 冉华, 陈坤华. 2006. 由相对地热梯度推断的腾冲火山区现存岩浆囊. 岩石学报, 22(6): 1517-1528. |
| [66] | 赵慈平, 冉华, 王云. 2012. 腾冲火山区的现代幔源氦释放: 构造和岩浆活动意义. 岩石学报, 28(4): 1189-1204. |
| [67] | 郑秀芬, 欧阳飚, 张东宁等. 2009. “国家数字测震台网数据备份中心”技术系统建设及其对汶川大地震研究的数据支撑. 地球物理学报, 52(5): 1412-1417. |
| [68] | 周瑞琦, 虢顺民, 何蔚. 1998. 龙陵—澜沧断裂带双震型强震活动破裂模型讨论. 地震地质, 20(3): 261-268. |