2. 中国科学院大学地球科学学院, 北京 100049
2. College of Earth Sciences, University of Chinese Academy of Sciences, Beijing 100049, China
410 km间断面是地球内部非常重要的速度跃变面,相关的研究结果对于理解地球深部物质性质、 运移以及相关的动力学过程均具有重要作用.410 km 间断面作为速度跃变界面出现于目前常用的一维参 考地球模型PREM(Dziewonski & Anderson,1981),IASP91(Kennett & Engdahl,1991)和AK135(Kennett et al., 1995)中,其速度跃变3%左右.根据地震资料分析所得到的410 km间断面强度及起伏形态,结合高温高压岩石矿物实验,一般认为该间断面是由α相橄榄石到瓦兹利石(β相橄榄石)的相变面(Collier et al., 2001).410 km 间断面的全球平均深度为418 km(Lawrence and Shearer, 2008)、起伏为±40 km(Chambers et al., 2005).该间断面在冷俯冲板块的作用下会上升(Collier et al., 2001),而在洋中脊或热点地区则会变深(Deuss,2007).从层析成像结果来看,俯冲板块在地幔中存在形态比较复杂(Li & van der Hilst,2010;Zhao et al., 2011),它不仅引起温度变化,还带来内部物质成分 的调整.铁、水或者其他挥发份的介入可以引起410 km 间断面上升且变宽(Smyth & Frost,2002; Deon et al., 2011),因而410 km间断面的存在及其形态要比一般认为的复杂得多.
随着地震观测覆盖范围和观测质量的不断提升,地震波形资料的不断积累,人们能够利用台网/ 台阵资料来提取特定强震相的弱前驱波(Revenaugh & Sipkin,1994)、 弱次生转换震相(Eagar et al., 2010; Liu et al., 2010; Tian et al., 2011; Xu et al., 2011)以及三重震相等研究地球内部精细结构,特别是弱的地幔间断面和部分速度异常区(Wang & Niu,2010; 张瑞青等,2011; Chu et al,2012; 叶玲玲和李娟,2012; Li et al,2013).这些方法各有优缺点:S波和P波接收函数方法是探测地球内部结构非常有用的技术,这种技术对间断面的形态和间断面的波阻抗差有非常好的约束,但是其受制于台站分布的限制;ScS多次反射波周期较长,能较好地约束间断面大尺度的起伏及密度和速度跳变,但对间断面附近的速度和速度梯度分辨率很低;P波和S波对地震波速度的深度变化比较敏感,这些地震波经过地球内部速度跃变面或区域间断面时会产生三重震相,因而在具有密集台站的地震台网资料的情况下,该方法可以非常有效地用于速度间断面存在以及精细速度结构的研究.
自Revenaugh和Sipkin(1994)获得410 km间断面上部存在低速层(此下称“410低速层”)的地震学证据以来,人们陆续在全球尺度或者区域尺度上对这一低速层的存在及性质展开研究,发现该低速层的厚度横向变化很大,一般为20~100 km不等.就区域性而言,410低速层相关研究结果主要位于环太平洋俯冲带地区(Revenaugh & Sipkin,1994; Dueker & Jasbinsek,2007; Song et al., 2004; Gao et al., 2006; Obayashi et al., 2006; Courtier & Revenaugh,2007; Bagley et al., 2009; Jasbinsek et al., 2010; Schaeffer & Bostock,2010; Vinnik et al., 2010)、伴生大型火山岩省的大陆克拉通地区(Chevrot et al., 1999; Vinnik & Farra, 2002,2007; Vinnik et al., 2003; Fee & Dueker,2004; Wittlinger & Farra,2007; Oreshin et al., 2011)等.该低速层的全球性结果也有报道(Tauzin et al., 2010).
目前一般认为该低速层是地球深部水导致地幔橄榄岩部分熔融而形成的(Hirth & Kohlstedt,1996),而深部水的来源有三个可能:俯冲到地幔转换带附近的板块物质脱水、地幔柱上行过程中含水硅酸盐脱水以及地幔转换带水过滤过程中产生的水聚集(Bercovici & Karato,2003).在俯冲带和洋中脊区域,地幔转换带水过滤过程与板块俯冲或地幔柱上升过程引起的低速异常应该是有叠加且有差别的,因此利用台网/台阵波形数据的三重震相开展410 km间断面顶部低速层精细结构以及区域性差异研究有助于明确低速层的存在范围以及速度变化的程度.
本文的研究区域位于扬子块体和华北块体交界处,其下方受到菲律宾海板块和西太平洋板块俯冲的影响,是研究俯冲板块对地幔速度结构影响的天然实验室.近几年建成的密集的中国地震台网(图 1)为地球内部精细结构研究提供了必要的数据支持.本文通过分析来自410 km深度附近的三重震相信息,对下扬子克拉通下方410 km深度附近波速结构特征进行分析.
2 数据和方法对于地幔间断面而言,三重震相的射线路径在地表浅层及岩石圈内大致相同,差别主要在间断面附近,因而三重震相的相对走时、振幅等信息能有效地约束间断面附近速度结构.如图 2所示,三重震相包括间断面之上的回折波震相AB,间断面上的反射波震相BC以及间断面之下的回折波震相CD.震相AB消失的距离与间断面之上的速度梯度变化和间断面深度有关;CD震相出现的距离对间断面深度和间断面以下的速度梯度非常敏感;AB和BC震相的相对到时和振幅可反映间断面之上的结构特征;AB与CD震相的到时差及波形特征主要反映间断面处的速度跳变大小等(Wang et al., 2006; 叶玲玲和李娟,2012;Li et al., 2013).为了获得三重震相的走时和波形随震中距变化的特征,本文使用 动态射线追踪(Tian et al., 2007)来计算理论走时,并利用反射率方法进行相应的波形拟合(Wang,1999).
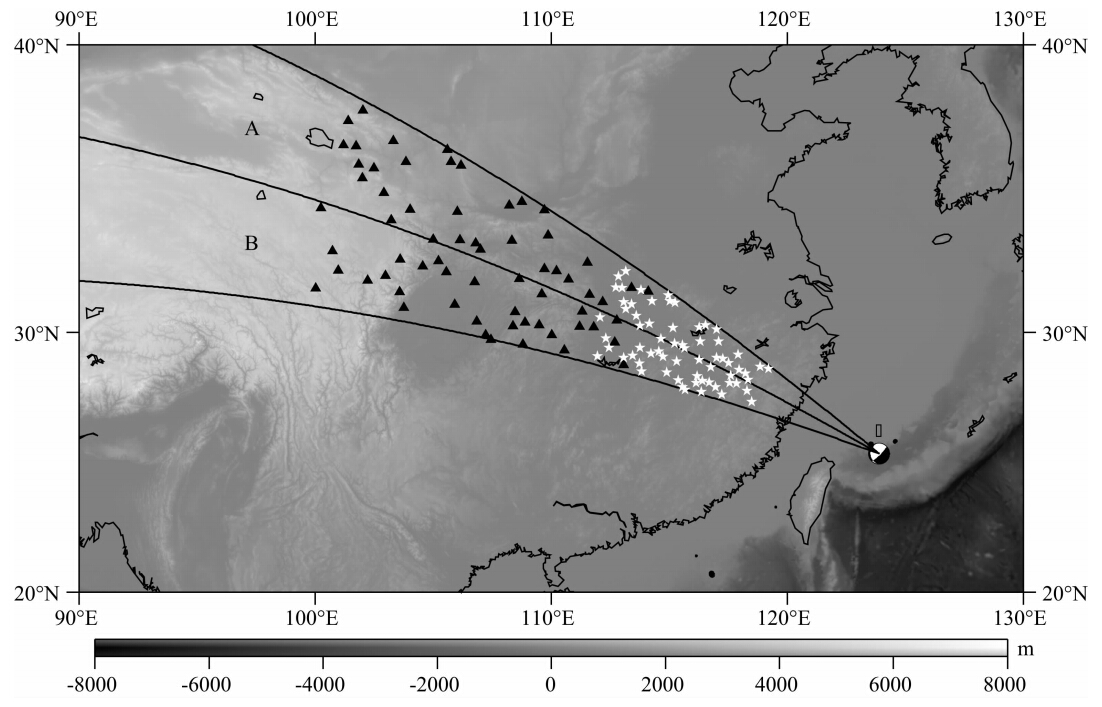 | 图 1 本文使用台站和地震分布图黑色三角形标出了台站位置,白色五角星为直达P波拐点在地表的投影,震源球表示地震位置,A、B表示两个研究区域,三条大圆弧给出了区域A、B范围,相邻两条大圆弧的夹角为10°.A区域拐点的深度范围在162~528 km,B区域拐点的深度范围在159~522 km.Fig. 1 Map showing the location of the earthquake and regional stations used in this paperThe black triangles indicate the location of stations,the white stars are the turning point of the direct P phases on the ground, and the beach ball marks the earthquake focus. A and B label two areas used in the paper, and each area exp and s with the angle of 10°. The depth of turning points in the A area is 162~528 km and B is 159~522 km. |
由于本文重点在于探讨410 km间断面的复杂结构,同时为了避免复杂震源过程以及震源附近地表及上地幔浅部复杂结构对观测资料的影响,我们选择了中国地震台网记录的发生于中国台湾东北方 的一个中深源地震的垂向波形资料.该地震位 于(25.435°,123.897°),发震时刻为2011-04-16 01 ∶ 11 ∶ 10.38,震级为Mb5.8,震源深度为131 km1),为美国国家地震信息中心(NEIC)基于宽频带波形 模拟得到的.该地震的震源时间函数比较简单,同时记录波形也具有较高的信噪比,有助于三重震相的识别.相比于清晰的P波三重震相,S波三重震相比较模糊,因而本文没有使用S波三重震相.为了对噪声进行一定的压制,本文对地震波形数据进行了0.05~1 Hz的带通滤波处理.该地震与410 km间断面相关的三重震相出现在10°~23°震中距范围内.为分析下扬子克拉通410 km间断面附近的速度结构的区域变化特征并保证有足够高质量观测波形随震中距的分布,本文按照方位将台站以10°方位角的间隔分成A和B两个区域进行分析(图 1).
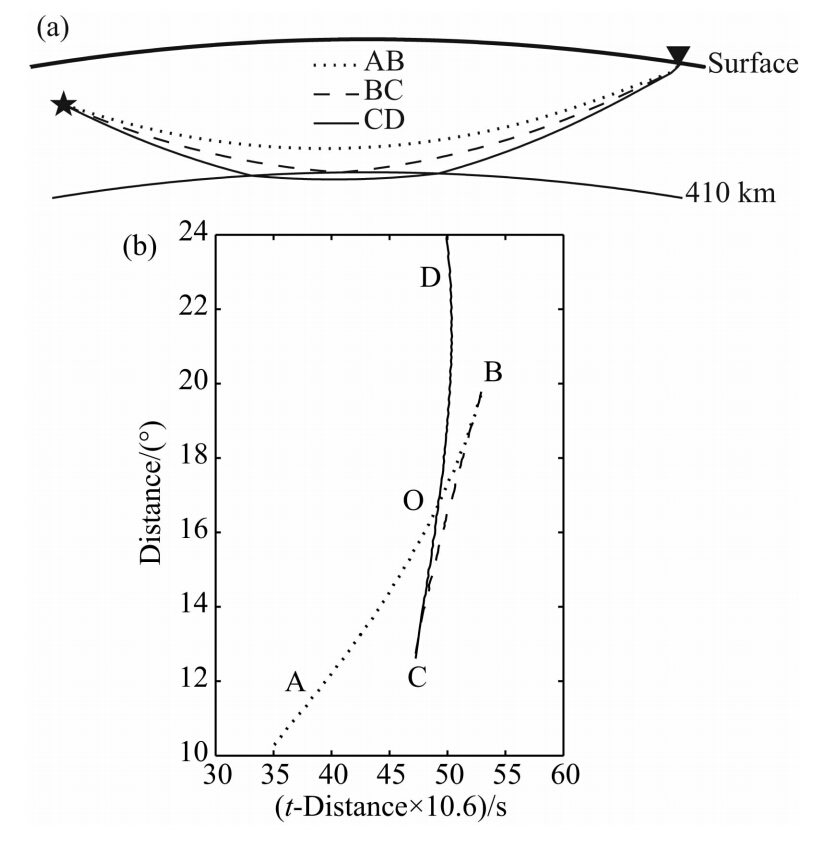 | 图 2(a)410 km间断面附近三重震相射线路径和(b)理论走时示意图.理论模型为IASP91(Kennett & Engdahl,1991),震源深度为131 km AB表示在间断面之上传播的直达P波;BC表示间断面的反射波;CD表示间断面之下传播的地震波. Fig. 2(a)Ray paths and (b)travel time curves of the triplications near the 410 km discontinuity for an event with focal depth of 131 km. The model used is IASP91 (Kennett & Engdahl,1991) The AB branch is the direct P wave propagating above the discontinuity; the BC branch is the reflection off the discontinuity; and the CD branch is the seismic wave traveling below the discontinuity. |
首先,我们对A区域(图 1)地震数据进行初步处理后得到了如图 3a中所示的P波三重震相剖面.由P波三重震相的形态可以看出,观测走时较之IASP91模型对应的理论走时滞后约3 s.一般地,走时系统性的偏差可能是由浅部的速度结构或者是震源深度确定不准造成的.系统性地去除掉震源深度误差,乃至浅部速度结构引起的三重震相走时的系统偏差不会影响到对于深部精细结构的认识(Tajima and Gr and ,1998; Wang and Chen, 2009). 本文使用的震源深度是由NEIC基于宽带波形拟合反演得到的,且国际地震中心(ISC)基于pP震相给出的震源深度则更深,位于139 km深度处,相应的理论走时则应更提前,而实际的观测走时则是滞后的,从而可以判定这一滞后与浅部的低速结构存在有关系.通过修改410 km间断面上的速度结构,我们得到了图 3b中所示的M-IASP91模型,该模型表明当上地幔存在一个低速异常时,能很好地拟合从10.5°(DWU台站)到16.3°(QLIT台站)各波形的直达P波走时的一致性,如图 3a中黑色点划线所示.由于AB震相终止在台站QLIT,利用修改后的M-IASP91模型对台站QLIT的直达P波射线追踪得到其拐点深度为353 km.353 km以下的速度结构将通过修改M-IASP91模型来模拟410 km间断面的P波三重震相进行有效地约束.
从图 3a实际观测资料可以看出,AB震相的终止距离为16.3°左右(台站QLIT处),AB震相未能和BC震相交于B点而是出现了明显的缺失,AOC和BOD较M-IASP91模型给出的理论值要明显加宽,这些现象表明410 km间断面上方应存在低速异常(Song et al., 2004),因而我们需要在410 km间断面上方设计一个低速异常来改变速度跃变量.在三重震相分析中,主要考虑间断面速度跃变量、间断面的深度、间断面尖锐程度(sharpness)以及间断面上下梯度变化等对到时和波形的影响(Song et al., 2004; Zhang et al., 2012; Li et al., 2013).考虑到这些因素,我们基于M-IASP91模型顺次构建了4种可能模型:410 km间断面上方存在一个厚度为57 km的低速异常(模型I);410 km间断面加深 至430 km(模型II);410 km间断面为一厚度为20 km 的梯度带(模型III);410 km间断面下方速度梯度增大(模型IV)(如图 4).我们利用反射率方法(Wang,1999)模拟了这些模型的理论地震图,并利用动态射线追踪方法给出了相应的走时曲线,分析模型结构变化对三重震相特征的影响,以期在观测数据中辨识这些特征.
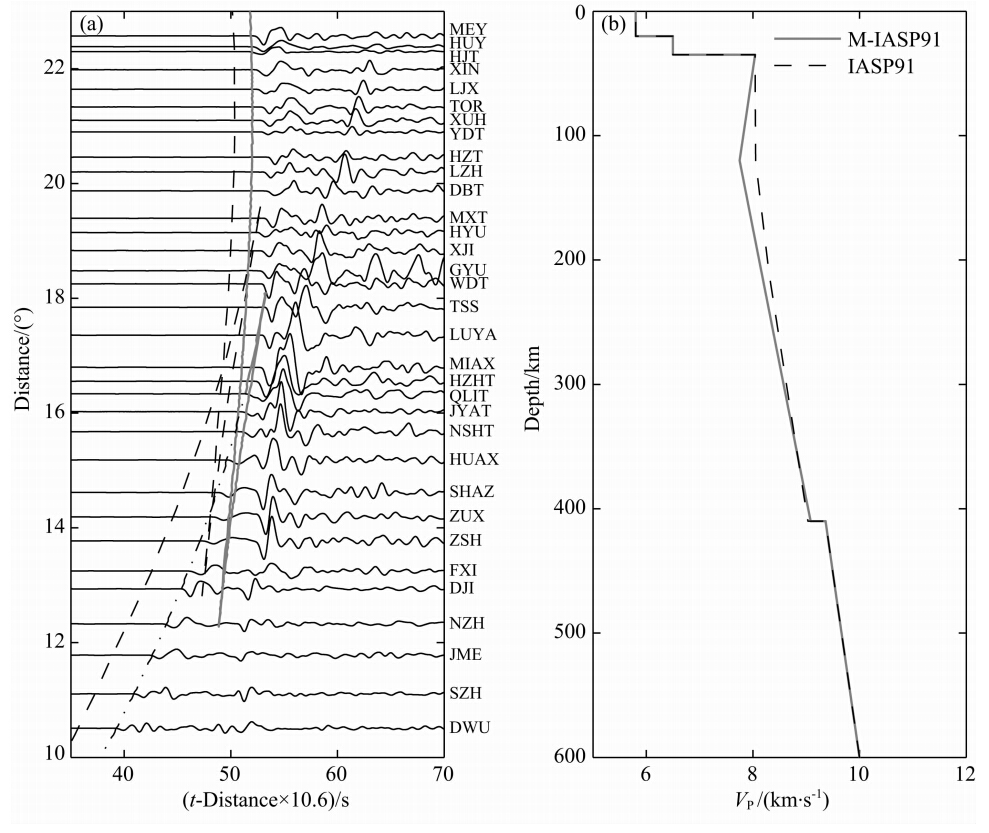 | 图 3(a)观测P波和理论走时曲线与(b)地球模型图 (a)中黑色实线为P波速度观测波形,黑色虚线为IASP91模型的理论走时曲线,灰色实线和黑色点划线为M-IASP91 模型理论走时曲线(详见正文说明);(b)中的黑色虚线代表IASP91速度模型,灰色实线为M-IASP91模型.Fig. 3(a)The observed direct P wave and theoretical travel time curves and (b)the earth modelThe black solid line in(a)represent the records of P wave velocity,the black dashed line is the theoretical travel time curve of IASP91 model, and the grey line and dash-dot line are for the M-IASP91 model; the black dashed line in(b)represents the velocity model of IASP91,the grey solid line is the M-IASP91 model. |
图 4中给出了M-IASP91参考模型及4个改进模型的P波走时曲线和理论地震图.对于M-IASP91模型,AB震相终止震中距约为18.1°,CD震相开始出现的震中距约为12.3°,AB和CD震相在约15.8°相交.当410 km间断面上方存在一个厚度为57 km的低速异常(模型I)时,AB震相消失的 比较早,未能与反射震相B′C相交;CD震相出现的比较早;反射波B′C的终止震中距明显加长;B′C和CD震相走时出现延时现象,导致AB震相与CD震相时差以及CD震相与B′C震相时差加大(图 4a).当间断面深度下降(模型II)时,AB加长,CD缩短,AOC加宽,BOD变窄(图 4b).当间断面为一梯度带(模型III)时,CD震相出现的距离明显增大,AB震相消失的距离基本不变(图 4c).当间断面下方速度梯度增大(模型IV)时,震相AB到时及终止距离基本没有变化,而CD震相出现的稍早,CD的走时曲线的曲率明显变大(图 4d).
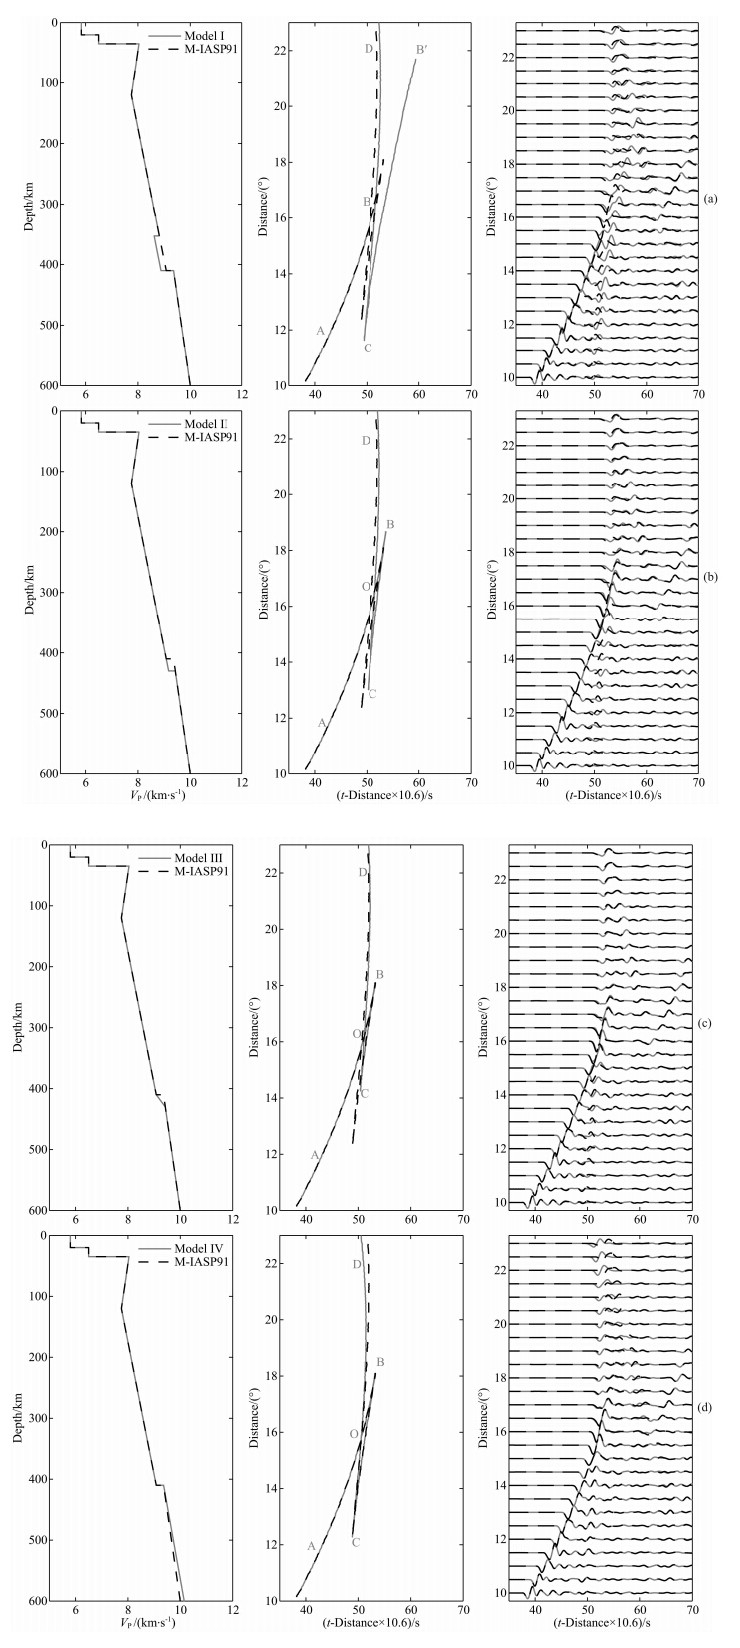 | 图 4 不同速度模型下的走时曲线与理论地震图图(a)、(b)、(c)、(d)分别对应着参考模型M-IASP91与410 km间断面上方存在一个低速层(模型I),410 km间断面加深至430 km(模型II),410 km间断面为一厚度为20 km的梯度带(模型III)以及410 km间断面下方速度梯度增大(模型IV)时的理论地震图及走时的对比.Fig. 4 The travel-time curves and theoretical seismograms for different velocity models (a—d)represent the comparisons of the theoretical seismograms and travel times among the reference model M-IASP91 and model I,II,III and IV,respectively.(a)represents a low-velocity layer atop the 410 km discontinuity(model I);(b)shows that the 410 km discontinuity extends to 430 km(model II);(c)illustrates that the 410 km discontinuity is a gradient zone with thickness of 20 km(model III);(d)represents the increased velocity gradient under the 410 km discontinuity(model IV). |
为了对比低速层存在的横向变化,我们将研究范围平分为A和B两个区域.从A区域的观测波形记录(图 5a)可以看出,AB震相的终止距离为16.3°左右(台站QLIT处),AB震相未能和BC震相交于B点而是出现了明显的缺失,AOC和BOD较M-IASP91模型所给出的理论形态要宽一些.结合上面的模型分析(图 4),可以确定A区域410 km间断面上方确实存在一个低速异常.CD震相出现的震中距较M-IASP91模型所给出的震中距要大,说明410 km间断面可能下降,也有可能是一个梯度间断面.CD震相的走时曲线的曲率有所增大,这种现象决定了410 km间断面下方速度梯度存在增大的情况.通过试错法,我们可以得到能很好地拟合观测资料的一维P波速度模型LYC-A(图 5c).该模型表明A区域如果在上地幔中存在一个低速层时,观测到的P波三重震相3 s系统性延迟可以消除掉;在410 km间断面上方存在一厚度约为57 km的低速层,速度减小了约4.5%;410 km间断面为一厚度为20 km的梯度带;410 km间断面下方的速度梯度较IASP91模型增大了约25.9%.
采用类似的方法,我们以LYC-A模型为起始模型得到了B区域下方的一维P波速度模型LYC-B(图 6c).从图 6a观测波形可以看出,当410低速层上界面下降17 km且低速层速度梯度变小时,能很好地拟合实际观测震相CD和B′C走时与LYC-A模型计算走时之间的残差.该模型表明在B区域同样需要一个低速区以消除P波三重震相的延迟;410 km间断面上方存在一个厚度为40 km的低速层,其速度减小了2.7%左右;410 km间断面为一厚度为20 km的梯度带;410 km间断面下方的速度 梯度较IASP91模型增大了约25.9%.在震中距 超过19.1°(台站SPA)之后,震相CD和B′C都出 现了明显的延时现象,而其相对时差没有明显变化,这可能与地震台站下方的速度不均匀体的存在有关.
4 讨论与结论地震层析成像结果可以很好地给出地球内部的速度异常分布形态,但其分辨率相对差一些.Li和van der Hilst(2010)一文中的图 4e及图 6h与图 6i 给出的与本研究区域相关的层析成像剖面结果显示,本区域存在着从西南往东北的由弱且薄到强且厚低速层.本文得到的低速层的存在与此类似,即西南边(B区域)40 km厚的低速层,且P波速度异常为2.7%;东北边(A区域)57 km厚的低速层,其P波速度异常为4.5%.但我们的研究结果的分辨率更高,能详细地给出410 km间断面附近的结构特征.同时,Revenaugh和Sipkin(1994)利用ScS多次混响发现在亚洲东部地幔转换带上方存在着近80 km 的低速层,而接收函数结果也显示在中国东部410 km 间断面上存在由南向北变厚的低速层(Tauzin et al., 2010).前人研究区域尺度更大而且使用的台站数很少,因而较之本文,对这一低速层存在的分辨能力也就低不少.
综合全球其他多个研究区域接收函数和ScS多次波等给出的结果来看,低速区的厚度大致在20~100 km,总体的厚度大致为60 km,相应的S波降低幅度在3%~7%(Schaeffer & Bostock,2010).这与本文区域性结果大致相当,且我们的结果分辨能力更高.目前对于该低速层成因的一般看法是挥发份在地幔转换带的存在而诱发地幔橄榄岩部分熔融而形成的.这些挥发份来源于俯冲物质或者地球深部的脱水与脱气过程(Bercovici & Karato,2003).水存在的质量比小于6.7%±0.6%时,410 km间断面之上部分熔融所导致的低速层可以稳定存在(Sakamaki et al., 2006).
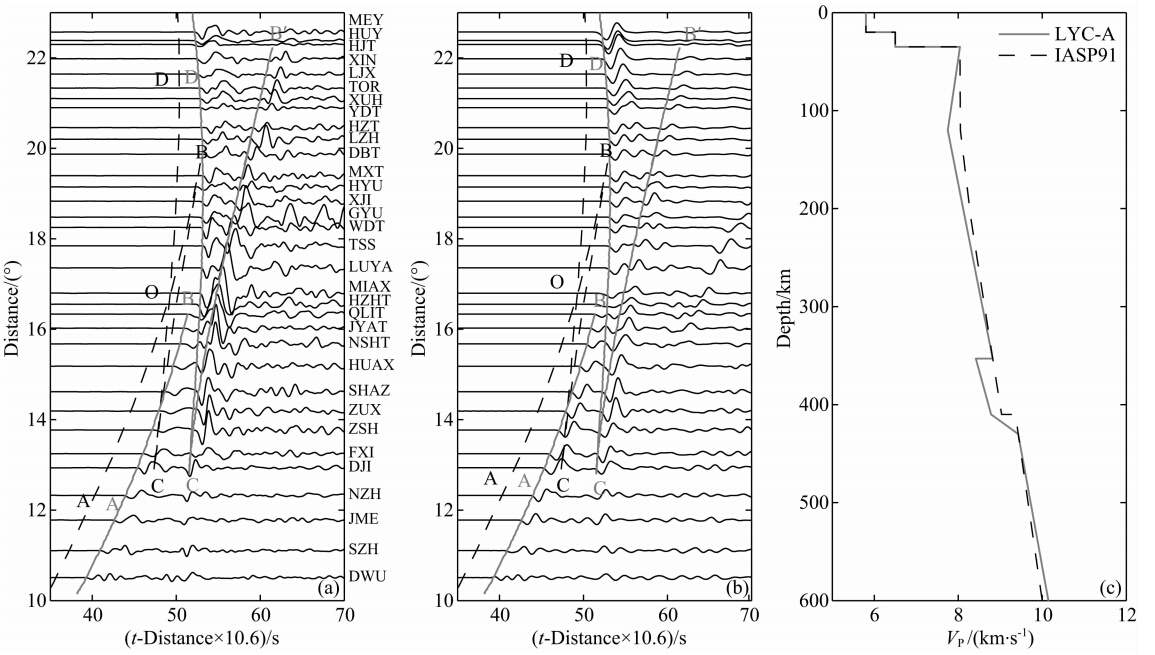 | 图 5 A区域观测和拟合波形及速度模型图图(a)中黑色实线为观测P波速度记录,图(b)中黑色实线为模拟P波速度记录.图(a)、(b)中的黑色虚线和灰色实线分别是 IASP91和最适模型LYC-A对应的理论走时.图(c)中黑色虚线代表IASP91速度模型,灰色实线代表区域A的最适速度模型.Fig. 5 Observed and synthetic waveforms in A area and velocity modelsThe black solid lines in(a) and (b)are the observed and synthetic seismograms of P triplications,respectively. The black dashed lines in(a) and (b)are the theoretical travel time of model IASP91; the grey solid lines in(a) and (b)indicate theoretical travel times for model LYC-A. The black dashed line and grey solid line in(c)represent model IASP91 and the best-fit velocity model LYC-A in A area,respectively. |
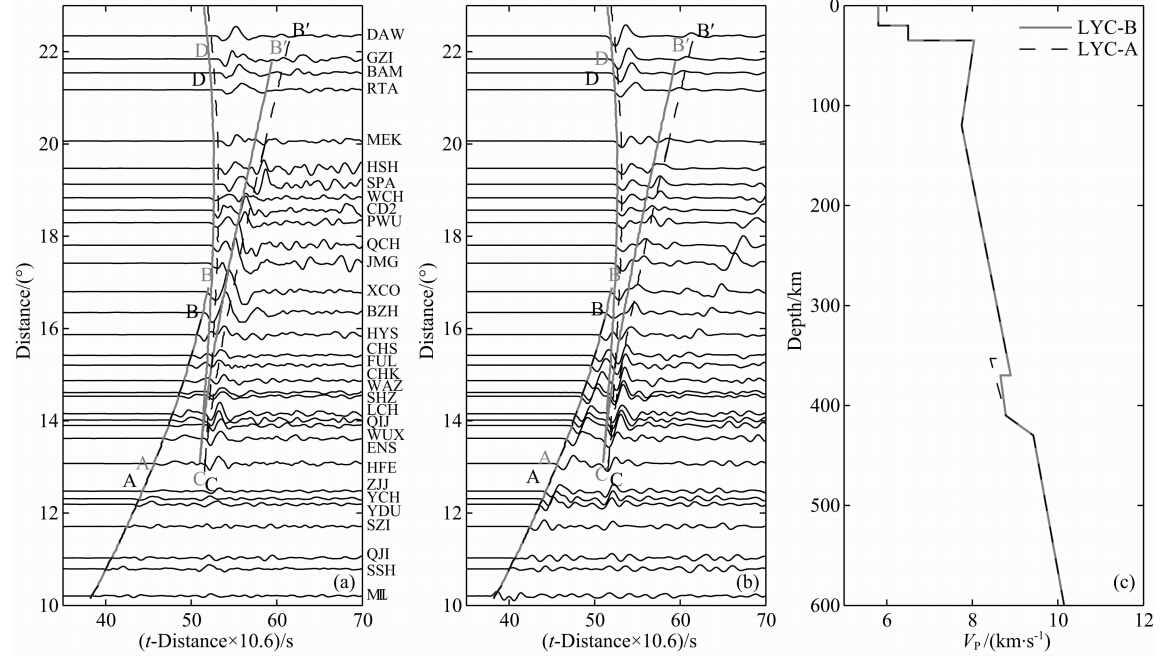 | 图 6 B区域观测和拟合波形及速度模型图图(a)中黑色实线为观测P波速度记录,图(b)中黑色实线为模拟P波速度记录.图(a)、(b)中的黑色虚线和灰色实线分别是 LYC-A和最适模型LYC-B对应的理论走时.图(c)中黑色虚线代表LYC-A速度模型,灰色实线代表区域B最适速度模型.Fig. 6 Observed and synthetic waveforms in B area and velocity modelsThe black solid lines in(a) and (b)are the observed and synthetic waveforms of P triplications respectively. The black dashed lines in(a) and (b)represent the theoretical travel times of model LYC-A; the grey solid lines in(a) and (b)indicate theoretical travel times of model LYC-B. The black dashed line and grey solid line in(c)represent model LYC-A and the best-fit velocity model LYC-B in B area,respectively. |
本研究区域所在的下扬子克拉通受到了西太平洋板块和菲律宾海板块俯冲的影响,克拉通下方的转换带内存在的高速异常得到了地震层析成像(Huang & Zhao,2006; 瞿辰等,2007;Li & van der Hilst,2010)结果的支持.在高温高压下,这些高速异常可能成了引起橄榄岩部分熔融的水或是其他挥发份的来源.与此同时,一些研究结果认为,地幔转换带顶部低速层发育于伴有大型火山岩省的大陆克拉通地区,并认为该低速层是由于地幔柱上涌引起的(Vinnik & Farra, 2002,2007; Vinnik et al., 2003),而下扬子克拉通在中生代时期存在大量的岩浆活动(Zhou & Li,2000; Li et al., 2003; Li & Li,2007).全面分析下扬子克拉通下方地幔转换带顶部低速层的成因需要有更详细和明晰的构造和地球化学特征方面的研究,以分析水或者其他挥发份的来源.
需要指出的是,本文中我们使用一维模型去近似三维的上地幔结构,得到的只是一个平均模型.从实际观测中可以看出(图 5),区域A中台站WDT和GYU的震相BC的到时出现了跃变,而不是一维模型所描述的缓变.BC震相在台站DBT和LZH也出现了类似的现象.这种现象说明扬子克拉通410 km深度附近结构存在明显的三维不均一性.要加深对扬子克拉通地幔转换带顶部低速层存在及其形态的认识,则需要进一步增加资料并基于三维射线追踪来详细研究该低速层的三维精细结构.
致谢 感谢中国地震局台网中心与国家数字测震台网数据备份中心提供的数据支持以及评阅人的宝贵意见.
| [1] | Bagley B, Courtier A, Revenaugh J. 2009. Melting in the deep upper mantle oceanward of the Honshu slab. Phys. Earth Planet. Inter. , 175(3-4): 137-144. |
| [2] | Bercovici D, Karato S I. 2003. Whole-mantle convection and the transition-zone water filter. Nature, 425(6953): 39-44. |
| [3] | Chambers K, Woodhouse J H, Deuss A. 2005. Topography of the 410 km discontinuity from PP and SS precursors. Earth Planet. Sci. Lett., 235(3-4): 610-622. |
| [4] | Chevrot S, Vinnik L, Montagner J P. 1999. Global-scale analysis of the mantle Pds phases. J. Geophys. Res., 104(B9): 20203-20219. |
| [5] | Chu R S, Schmandt B, Helmberger D V. 2012. Upper mantle P velocity structure beneath the Midwestern United States derived from triplicated waveforms. Geochem. Geophy. Geosy., 13(2), doi:10.1029/2011GC003818. |
| [6] | Collier J D, Helffrich G R, Wood B J. 2001. Seismic discontinuities and subduction zones. Phys. Earth Planet. Inter. , 127(1-4): 35-49. |
| [7] | Courtier A M, Revenaugh J. 2007. Deep upper-mantle melting beneath the Tasman and Coral Seas detected with multiple ScS reverberations. Earth Planet. Sci. Lett. , 259(1-2): 66-76. |
| [8] | Deon F, Koch-Muller M, Rhede D, et al. 2011. Water and iron effect on the P-T-x coordinates of the 410 km discontinuity in the Earth upper mantle. Contrib. Mineral. Petrol. , 161(4): 653-666. |
| [9] | Deuss A. 2007. Seismic observations of transition-zone discontinuities beneath hotspot locations.//Plates, Plumes and Planetary Processes. GSA Spec. Pap. , 430: 121-136. |
| [10] | Dziewonski A M, Anderson D L. 1981. Preliminary reference Earth model. Phys. Earth Planet. Inter. , 25(4): 297-356. |
| [11] | Eagar K C, Fouch M J, James D E. 2010. Receiver function imaging of upper mantle complexity beneath the Pacific Northwest, United States. Earth Planet. Sci. Lett. , 297(1-2): 141-153. |
| [12] | Fee D, Dueker K. 2004. Mantle transition zone topography and structure beneath the Yellowstone hotspot. Geophys. Res. Lett., 31(18), L18603: doi:10. 1029/2004GL020636. |
| [13] | Gao W, Matzel E, Grand S P. 2006. Upper mantle seismic structure beneath eastern Mexico determined from P and S waveform inversion and its implications. J. Geophys. Res., 111(B8): B08307, doi:10.1029/2006JB004304. |
| [14] | Dueker K, Jasbinsek J J. 2007. Ubiquitous low-velocity layer atop the 410 km discontinuity beneath the northern Rocky Mountains. Geochem. Geophy. Geosy., 8, Q10004, doi:10.1029/2007GC001661. |
| [15] | Jasbinsek J J, Dueker K G, Hansen S M. 2010. Characterizing the 410 km discontinuity low-velocity layer beneath the LA RISTRA array in the North American Southwest. Geochem. Geophy. Geosy., 11(3): Q03008, doi:10.1029/2009GC002836. |
| [16] | Hirth G, Kohlstedt D L. 1996. Water in the oceanic upper mantle: implications for rheology, melt extraction and the evolution of the lithosphere. Earth Planet. Sci. Lett. , 144(1-2): 93-108. |
| [17] | Huang J L, Zhao D P. 2006. High-resolution mantle tomography of China and surrounding regions. J. Geophys. Res., 111(B9): B09305, doi:10.1029/2005JB004066. |
| [18] | Kennett B L N, Engdahl E R. 1991. Traveltimes for global earthquake location and phase identification. Geophys. J. Int. , 105(2): 429-465. |
| [19] | Kennett B L N, Engdahl E R, Buland R. 1995. Constraints on seismic velocities in the Earth from traveltimes. Geophys. J. Int. , 122(1): 108-124. |
| [20] | Lawrence J F, Shearer P M. 2008. Imaging mantle transition zone thickness with SdS-SS finite-frequency sensitivity kernels. Geophys. J. Int. , 174(1): 143-158. |
| [21] | Li C, Van Der Hilst R D. 2010. Structure of the upper mantle and transition zone beneath Southeast Asia from traveltime tomography. J. Geophys. Res., 115(B7): B07308, doi:10. 1029/2009JB006882. |
| [22] | Li J, Wang X, Wang X J, et al. 2013. P and SH velocity structure in the upper mantle beneath Northeast China: Evidence for a stagnant slab in hydrous mantle transition zone. Earth Planet. Sci. Lett. , 367: 71-81. |
| [23] | Liu Q Y, Li Y, Chen J H, et al. 2010. Joint inversion of receiver function and ambient noise based on Bayesian theory. Chinese J. Geophys., 53(11): 2603-2612. |
| [24] | Li Z X, Li X H, Kinnyc P D. 2003. Geochronology of Neoproterozoic syn-rift magmatism in the Yangtze Craton, South China and correlations with other continents: evidence for a mantle superplume that broke up Rodinia. Precambrian Res. , 122(1-4): 85-109. |
| [25] | Li Z X, Li X H. 2007. Formation of the 1300 km-wide intracontinental orogen and postorogenic magmatic province in Mesozoic South China: A flat-slab subduction model. Geology, 35(2): 179-182. |
| [26] | Obayashi M, Sugioka H, Yoshimitsu J, et al. 2006. High temperature anomalies oceanward of subducting slabs at the 410 km discontinuity. Earth Planet. Sci. Lett. , 243(1-2): 149-158. |
| [27] | Oreshin S I, Vinnik L P, Kiselev S G, et al. 2011. Deep seismic structure of the Indian shield, western Himalaya, Ladakh and Tibet. Earth Planet. Sci. Lett., 307(3-4): 415-429. |
| [28] | Qu C, Zhou H L, Zhao D P. 2007. Deep structure beneath the west margin of Philippine Sea Plate and South China Sea from P and S wave travel time tomography. Chinese J. Geophys. (in Chinese), 50(6): 1757-1768. |
| [29] | Revenaugh J, Sipkin S A. 1994. Seismic evidence for silicate melt atop the 410 km mantle discontinuity. Nature, 369(6480): 474-476. |
| [30] | Sakamaki T, Suzuki A, Ohtani E. 2006. Stability of hydrous melt at the base of the Earth's upper mantle. Nature, 439(7073): 192-194. |
| [31] | Schaeffer A J, Bostock M G. 2010. A low-velocity zone atop the transition zone in northwestern Canada. J. Geophys. Res., 115(B6): B06302, doi:10.1029/2009JB006856. |
| [32] | Smyth J R, Frost D J. 2002. The effect of water on the 410 km discontinuity: an experimental study. Geophys. Res. Lett., 29(10), 1485, doi:10.1029/2001GL014418. |
| [33] | Song T R A, Helmberger D V, Grand S P. 2004. Low-velocity zone atop the 410 km seismic discontinuity in the northwestern United States. Nature, 427(6974): 530-533. |
| [34] | Tajima F, Grand S P. 1998. Variation of transition zone high-velocity anomalies and depression of 660 km discontinuity associated with subduction zones from the southern Kuriles to Izu-Bonin and Ryukyu. J. Geophys. Res. , 103(B7): 15015-15036. |
| [35] | Tauzin B, Debayle E, Wittlinger G. 2010. Seismic evidence for a global low-velocity layer within the Earth's upper mantle. Nature Geosci. , 3(10): 718-721. |
| [36] | Tian Y, Hung S H, Nolet G, et al. 2007. Dynamic ray tracing and traveltime corrections for global seismic tomography. J. Comput. Phys. , 226(1): 672-687. |
| [37] | Tian X B, Teng J W, Zhang H S, et al. 2011. Structure of crust and upper mantle beneath the Ordos Block and the Yinshan Mountains revealed by receiver function analysis. Phys. Earth Planet. Inter., 184(3-4): 186-193. |
| [38] | Vinnik L, Farra V. 2002. Subcratonic low-velocity layer and flood basalts. Geophys. Res. Lett., 29(4): 1049, doi:10. 1029/2001GL014064. |
| [39] | Vinnik L, Farra V. 2007. Low S velocity atop the 410 km discontinuity and mantle plumes. Earth Planet. Sci. Lett., 262(3-4): 398-412. |
| [40] | Vinnik L, Kumar M R, Kind R, et al. 2003. Super-deep low-velocity layer beneath the Arabian plate. Geophys. Res. Lett., 30(7): 1415, doi:10. 1029/2002GL016590. |
| [41] | Vinnik L, Ren Y, Stutzmann E, et al. 2010. Observations of S410p and S350p phases at seismograph stations in California. J. Geophys. Res., 115(B5): B05303, doi:10. 1029/2009JB006582. |
| [42] | Wang B S, Niu F L. 2010. A broad 660 km discontinuity beneath northeast China revealed by dense regional seismic networks in China. J. Geophys. Res., 115(B6), doi: 10.1029/2009JB006608. |
| [43] | Wang R J. 1999. A simple orthonormalization method for stable and efficient computation of Green's functions. Bull. Seism. Soc. Am., 89(3): 733-741. |
| [44] | Wang T, Chen L. 2009. Distinct velocity variations around the base of the upper mantle beneath northeast Asia. Phys. Earth Planet. Inter. , 172(3-4): 241-256. |
| [45] | Wang Y, Wen L X, Weidner D, et al. 2006. SH velocity and compositional models near the 660 km discontinuity beneath South America and northeast Asia. J. Geophys. Res., 111(B7), B07305, doi:10.1029/2005JB003849. |
| [46] | Wittlinger G, Farra V. 2007. Converted waves reveal a thick and layered tectosphere beneath the Kalahari super-craton. Earth Planet. Sci. Lett. , 254(3-4): 404-415. |
| [47] | Xu W W, Zheng T Y, Zhao L. 2011. Mantle dynamics of the reactivating North China Craton: Constraints from the topographies of the 410 km and 660 km discontinuities. Sci. China Earth Sci., 54(6): 881-887, doi:10. 1007/s11430-010-4163-0. |
| [48] | Ye L L, Li J. 2012. Detecting velocity structure around 660 km discontinuity beneath Northeastern China. Acta Seismol. Sin. (in Chinese), 34(2): 137-146. |
| [49] | Zhang R Q, Wu Q J, Li Y H, et al. 2012. Lateral variations in SH velocity structure of the transition zone beneath Korea and adjacent regions. J. Geophys. Res., 117, B09315, doi:10.1029/2011JB008900. |
| [50] | Zhang R Q, Wu Q J, Li Y H, et al. 2011. Differential patterns of SH and P wave velocity structures in the transition zone beneath northwestern Tibet. Sci. China Earth Sci., 54(10): 1551-1562, doi: 10. 1007/s11430-011-4228-8. |
| [51] | Zhao D P, Yu S, Ohtani E. 2011. East Asia: Seismotectonics, magmatism and mantle dynamics. J. Asian Earth Sci. , 40(3): 689-709. |
| [52] | Zhou X M, Li W X. 2000. Origin of Late Mesozoic igneous rocks in Southeastern China: implications for lithosphere subduction and underplating of mafic magmas. Tectonophysics, 326(3-4): 269-287. |
| [53] | 瞿辰, 周蕙兰, 赵大鹏. 2007. 使用纵波和横波走时层析成像研究菲律宾海板块西边缘带和南海地区的探部结构. 地球物理学报, 50(6): 1757-1768. |
| [54] | 叶玲玲, 李娟. 2012. 东北地区660 km间断面附近波速结构研究. 地震学报, 34(2): 137-146. |
| [55] | 张瑞青, 吴庆举, 李永华等. 2011. 藏西北地幔过渡带地震波速度结构研究. 中国科学: 地球科学, 41(5): 700-712. |
 2014, Vol. 57


