2. 武汉大学空间环境与大地测量教育部重点实验室, 武汉 430072
2. Key Laboratory of Geospace Environment and Geodesy, CNEM, Wuhan University, Wuhan 430072, China
1 引言
观测证明,地球电离层中存在大量的离子逃逸到磁层.高纬顶部电离层上行离子是磁层等离子的重要来源,这些电离层上行离子在电离层-磁层耦合中起重要作用(Horwitz and Moore, 1997; Moore et al., 1999; Chappell et al., 2000).由于单电荷氧离子在太阳风中几乎不存在,所以磁层中的O+离子来源于电离层(Shelley et al., 1972; Frank et al., 1977).上行H+和O+离子的一个重要差别是后者与地磁活动性的强烈相关:在磁暴期间,等离子体片和环电流中O+离子成分极大地增强,有时会成为暴时环电流的主要成分(Nosé et al., 2001,2003,2005).因此电离层上行O+离子,对磁暴期间等离子体片和环电流动力学起重要作用(Huddleston et al., 2005; Ebihara et al., 2006).环电流中的电离层O+离子源于何处,这些源自电离层的O+离子的上行区域的纬度跨度是怎样的,是什么驱动力将它们加速进入磁层,是电离层与磁层耦合研究中的重要课题.
通过卫星和地面雷达观测,人们发现在两百公里到几个地球半径的范围内存在持续不断向外流的电离层等离子体(Abe et al., 1993; André et al., 1994; Øieroset et al., 1999; Ogawa et al., 2009; 2010; Nilsson et al., 2013).离子上行受太阳活动周期与地磁活动影响.离子上行发生率与F10.7指数、太阳风压强度和Kp指数有关,同时还受行星际磁场IMF的影响(Ogawa et al., 2009; 2010; Cully et al., 2003).Wu等(2000)使用DE-2卫星在300~1000 km的高度范围观测发现,离子上行主要发生在极尖区和极光椭圆区600 km以上的高度.研究发现(Andersson et al., 2004; Peterson et al., 2006),在极光椭圆区和极盖区的任何地方时都可能发生离子上行,但是在磁正午和磁午夜上行发生率最大.Ogawa等使用ESR雷达在500 km高度观测到,离子上行的最大发生率在磁正午扇区(Ogawa et al., 2009);而使用EISCAT雷达在200~550 km高度观测到,离子上行的最大发生率在磁午夜扇区(Ogawa et al., 2010).利用DMSP F13卫星的观测数据,霍亮等(2006)比较1995年到2005年地磁平静期和8个磁暴期间的离子上行特征发现,磁暴期间强上行事件的发生率比平静期高近2倍.利用DMSP F13和F15卫星的观测数据,Coley和Heelis(2009)对1998年到2003年的12个磁暴期间的高纬电离层的离子上行进行叠加分析发现,磁暴急始之后,14小时之内,离子上行通量存在明显的增加.但是这些研究主要是对地磁平静期的离子上行的观测分析,对于磁暴期间离子整体上行特征以及相应的上行机制的研究涉及较少.这些结果表明:暴时电离层离子上行特征有必要进行深入的研究.
在电离层高度范围内,离子上行速度随着高度的升高而增加(Ogawa et al., 2010; Wu et al., 2000).这表明,离子在上行过程中必然得到了加速.在电离层中,离子上行的主要加速机制包括(1)强对流引起的摩擦加热(Loranc et al., 1991; Heelis et al., 1993; Strangeway et al., 2005);(2)电离层电子加热,产生双极电场(Whitteker,1977; Seo et al., 1997; Tam et al., 2007);(3)对流剪切激发等离子体不稳定性,引起加热(Ganguli et al., 1994; Liu and Lu, 2004);(4)环电流离子沉降(Yeh and Foster, 1990).对于以上哪种加速机制起主要作用还没有定论,需要进一步研究.此外,在较高的高度,离子上行还与太阳风动压、软电子沉降、光电子有 关.André和Yau(1997),Moore和Horwitz(2007),Yau等(2011)很好地总结了这些可能的加速机制.
本文利用DMSP F13和F15卫星的观测数据,对高纬顶部电离层离子整体上行进行研究,主要考察磁暴期间电离层离子上行特征参量的时空分布规律;在此基础上,初步探讨磁暴期间,电离层上行离子的源区特性及可能的驱动机制.
2 卫星数据及离子上行事件判定本文利用DMSP(Defense Meteorological Satellite Program)F13和F15卫星的观测数据,对2001— 2005年58个磁暴(-472 nT≤Min.Dst≤-71 nT)期间高纬顶部电离层离子上行特征进行了统计研究.DMSP卫星运行轨道为近圆形太阳同步轨道,倾角为98°,高度约840 km.DMSP卫星绕地球运行一圈的周期约为100 min,每天由南向北(升段)和由 北向南(降段)分别在固定的地方时(F13约为0600—1800 UT,F15约为0900—2100 UT)经过赤道面(Heelis and Hairston, 1990; Hairston and Heelis, 1993).
图 1为所选磁暴期间,DMSP F13和F15卫星在南北半球的轨道覆盖.图中只给出在本文研究所 关心的±50° MLat以上纬度区的覆盖情况.Coley和Heelis(1998)曾指出:南北半球磁极和地理极点偏差的不同,可能会对各自的电离层现象产生很大的差异.因此本文对南北半球的结果分开讨论而不作对比.
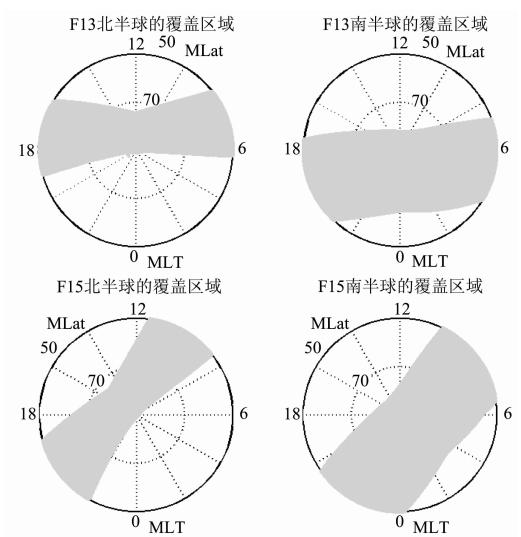 | 图 1 本文研究磁暴期间DMSP F13和F15卫星的轨迹覆盖图 Fig. 1 Tracks coverage of DMSP F13 and F15 during geomagnetic storms involved in this paper |
本文使用DMSP卫星携带的SSIES数据,能够提供3种类型的信息:等离子体的整体漂移速度分量(Vx,Vy和Vz)、等离子体的密度(Ni)、等离子体的组成(H+、He+和O+的数密度百分比)、离子和电子的温度(Ti和Te)等;这些数据每4 s一次采样.每一组数据都有质量标记,本文只采用质量可靠的数据.考虑到电离层离子主要沿磁力线上行,因此,本文利用IGRF-11磁场模型(Finlay et al., 2010),通过坐标转换,获得离子沿卫星所在磁力线方向的速度(记为Vb).Vb平行于磁力线取值为正,反平行于磁力线为负.
对于上行事件的判定,Keating等(1990)认为,当速度或通量远超于正常值时,可以认定为上行事 件.然而,当密度很大而速度较小时,通过通量判定上行事件的标准显然不太合理.本文采用速度判定标准.Endo等(2000)使用EISCAT雷达观测到,在 800 km高度,离子向上漂移速度大多都低于200 m·s-1. 离子要 达到此速度,必须受到额外的加速,因此200 m·s-1 是合理的门限值.为了消除噪声信号的影响,本文将至少包含连续3个速度不低于200 m·s-1的数据点,判定为一个离子上行事件;在此期间,卫星飞过的区域,记为该上行事件的上行区域.
图 2给出了从DMSP卫星观测判定离子上行事件的一个示例.在2001年3月19日1356—1423 UT 期间,DMSP F13卫星从日侧向夜侧飞越南半球极区,图 2给出了离子沿场速度(Vb)随磁纬(MLat)的变化.不难看出,F13卫星在图中两对红线内观测到的Vb均大于门限值200 m/s.根据我们选定的标准,这2组事件被判定为离子上行事件.
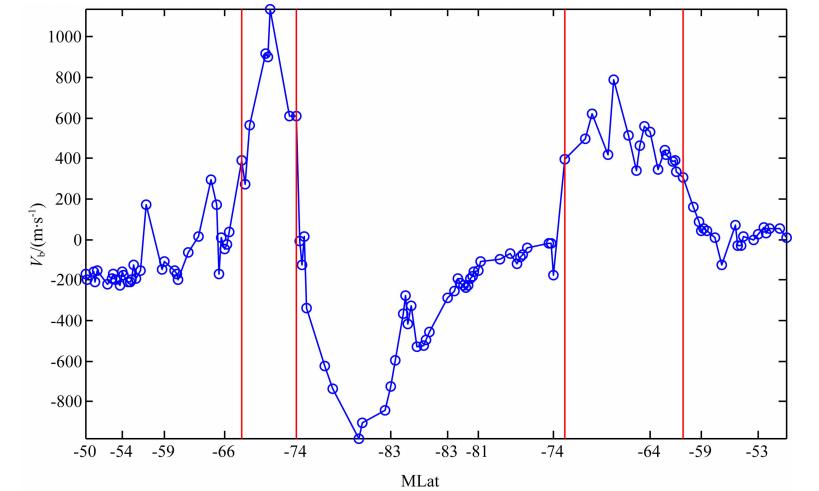 | 图 2 根据DMSP卫星观测数据判定离子上行事件的一个示例 在2001年3月19日1356—1423 UT期间,F13卫星从日侧向夜侧飞越南半球极区.被判定的两组离子上行事件由两对红线标识出. Fig. 2 An Illustration of ion up-flow events identified from DMSP observations During the period of 1356—1423 UT on March 19,2001,spacecraft F13 was crossing the Antarctic from dayside to nightside. The identified ion up-flow events were indicated by the two pairs of vertical red lines. |
为了研究离子上行发生率随时空的分布,对MLat×MLT坐标平面进行网格划分.我们将其划分为240个网格,MLat分为8组,间隔取5°;MLT分为24组,间隔为1 h.为保证统计结果的可靠性,如果DMSP卫星飞经某一个网格的次数(卫星穿行次数)少于100次,那么该网格内数据不参与统计.在本文所研究的磁暴期间,网格内卫星穿行次数最多的达1929次;各网格的平均穿行次数为810次. 对于时空区域跨越2个或以上网格的上行事件,我们将离子最大上行速度位置所在的网格区域,记为上行事件所在的网格区域.
我们将离子上行发生率记为P,定义如下:

其中,Nup表示在所选网格区域内DMSP卫星观测到的上行事件次数,Nall表示卫星经过该网格区域的次数.Liu等(2001)将离子上行发生率定义为:上行速度大于门限值的观测点数与总观测点数的比值.Ogawa等(2009,2010)将离子上行发生率定义为:离子上行事件次数与总观测次数的比值,这与我们的定义类似.
图 3给出了磁暴期间DMSP卫星在北半球观 测到的离子上行事件发生率随MLT和MLat的分布. 不难看出,离子上行主要发生在60°~80° MLat; 表现出两个离子上行高发区,一个高发区出现在磁正午前后(1100—1300 MLT),最大发生率为15%,另一个高发区出现在磁傍晚(1800—2100 MLT),最大发生率为18%.
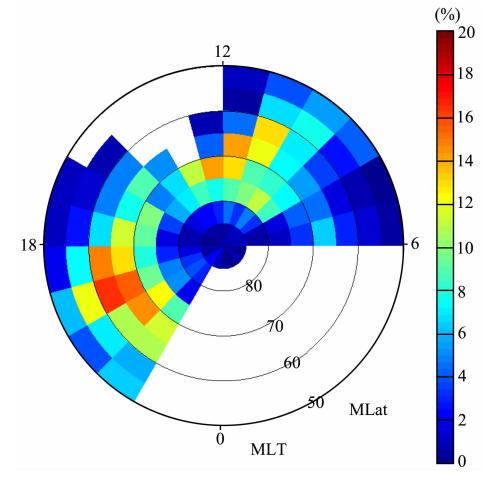 | 图 3 磁暴期间北半球离子上行发生率的时空分布(图中空白处无数据,下同) Fig. 3 Temporal-spatial distribution of ion up-flow occurrence during geomagnetic storms in the Northern Hemisphere(Blank in the figure presents no data,similarly hereinafter) |
利用ESR雷达观测,Ogawa等(2009)发现磁暴期间在500 km高度上,离子上行的最大发生率出现在磁正午前后扇区(极尖/极隙区附近);最大发生率约为20%.这与我们的结果相符.
图 4给出了磁暴期间DMSP卫星在南半球观测到的离子上行事件发生率的时空分布.在南半球,DMSP卫星轨道主要覆盖夜侧,离子上行事件主要发生在磁子夜前55°~75° MLat.与北半球类似,南半球离子上行也表现出两个高发区:一个出现在磁傍晚(2000—2100 MLT),最大发生率为16%;另一个出现在磁午夜前后(2200—0100 MLT),最大发生率为20%.
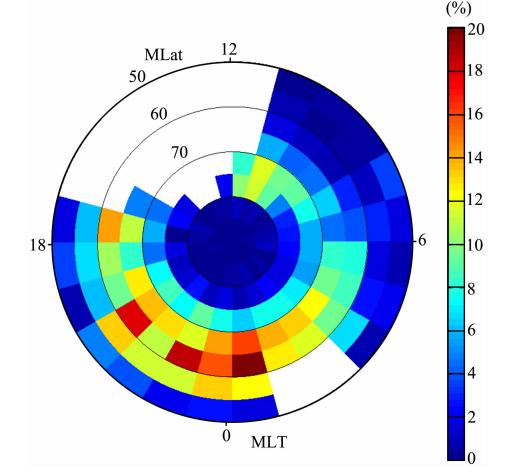 | 图 4 磁暴期间南半球离子上行发生率的时空分布 Fig. 4 Temporal-spatial distribution of ion up-flow occurrence during geomagnetic storms in the Southern Hemisphere |
图 5给出了磁暴期间DMSP卫星在北半球观测到的离子上行平均速度随MLT和MLat的分布,网格划分不变.为保证统计结果的有效性,每个 网格区域至少包含10个上行事件,否 则不参与统计.在某一网格内,离子上行的平均速度定义为该网格内各上行事件最大Vb的均值.从图 5不难看出,北半球离子的上行速度多集中在400 m·s-1到700 m·s-1之 间,显著高于本文判定标准预设的门限值(200 m·s-1). 在磁正午前,高速的离子上行(≥500 m·s-1)多集 中在65° MLat以上区域;午后,高速离子上行区向低纬度扩展至约55° MLat,其上行速度要略高于磁正午前.
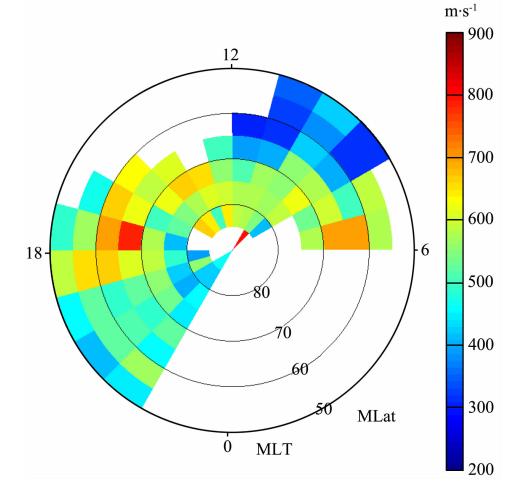 | 图 5 磁暴期间,北半球顶部电离层离子上行平均速度随MLT和MLat的分布 Fig. 5 Temporal-spatial distribution of the average velocities of storm-time up-flowing ions in the Northern Hemisphere |
图 6 给出了南半球暴时离子上行速度的时空分布.图 6表明,在磁午夜前,DMSP卫星在考察区域内几乎所有的纬度上都观测到了高速上行的离子;午夜后,各纬度上观测到上行离子的速度明显降低.
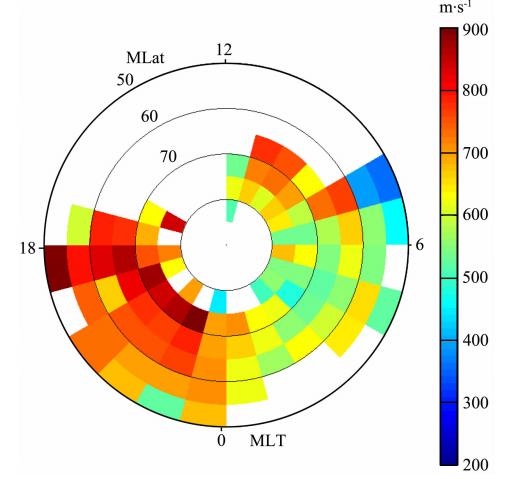 | 图 6 磁暴期间,南半球顶部电离层离子上行平均速度随MLT和MLat的分布 Fig. 6 Temporal-spatial distribution of the average velocities of storm-time up-flowing ions in the Southern Hemisphere |
利用EISCAT雷达观测,Ogawa等(2010)发现,在磁暴期间,400 km高度上,典型的离子上行速度为120 m·s-1,与顶部电离层的离子上行速度相比明显较小,表明离子在上行过程中得到了加速.
3.3 离子上行区域的纬度跨度我们将卫星在持续观测到离子上行事件期间所飞越的空间定义为离子上行区.由于DMSP卫星的高倾角轨道,它在穿越离子上行区时,纬度变化占主导地位.因此,利用DMSP卫星观测数据,可提取离子上行区的纬度信息.对落在同一网格内各离子上行区的纬度跨度取中值,即可得到该网格内离子上行区的平均跨度.
图 7给出了北半球磁暴期间离子上行区纬度跨度随MLT和MLat的分布.容易看出,磁正午前,离子上行发生在相对宽广的纬度空间,尤其是在0900MLT的极光椭圆纬度附近,离子上行区的纬度跨度超过3°.午后,离子上行区相对较窄,一般横跨2个纬度左右.
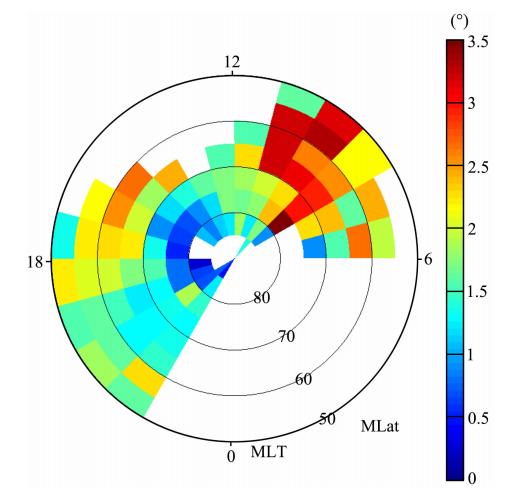 | 图 7 磁暴期间,北半球离子上行区域纬度跨度的时空分布 Fig. 7 Temporal-spatial distribution of latitudinal extent of ion up-flow region in the Northern Hemisphere |
图 8给出了磁暴期间离子上行区纬度跨度在南半球的分布情况.较低纬度上(50°~60° MLat),离子上行区域纬度相对较宽,约2°左右;在极光椭圆区及极盖区,离子上行区域相对较窄,在约0.5°~1°间变化.
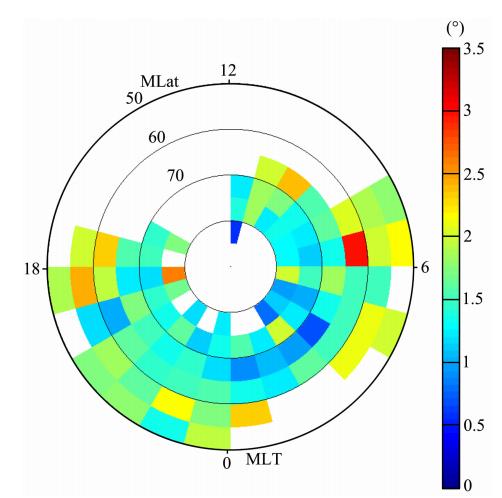 | 图 8 磁暴期间,南半球离子上行区域纬度跨度的时空分布 Fig. 8 Temporal-spatial distribution of latitudinal extent of ion up-flow region in the Southern Hemisphere |
极区电离层是磁层等离子体的重要源区.近期的观测和模拟研究都表明,离子加热和电子加热对电离层离子上行有重要贡献(Keating et al., 1990; Liu et al., 2001; Su et al., 1999; Skjæveland et al., 2011).利用DE-2卫星的观测数据,Loranc等(1991)发现在电离层较低高度和较高高度,上行离子的形态特征存在很高的相似性,将电离层离子上行的主要驱动源归因于离子摩擦加热.利用DE-2卫星长期的观测数据,Seo等(1997)发现离子上行与电子加热间存在较高的相关性,认为软电子沉降引起的电子加热对电离层离子上行有重要驱动作 用.电子加热会产生双极电场,驱动离子上行(Ogawa et al., 2010; Tam et al., 2007).相对于离子加热,电子加热对离子上行的加速作用效果更加明显(Seo et al., 1997; Liu et al., 2001; 1995).
图 9给出了磁暴期间(a)和暴时离子上行期间(b)DMSP卫星在北半球观测到电子平均温度的时空分布.对比两幅图不难看出,磁暴期间在绝大数网格内,与离子上行相伴随的电子平均温度(图 9b)要明显高于磁暴期间的电子平均温度(图 9a),典型的温度差约为260 K.
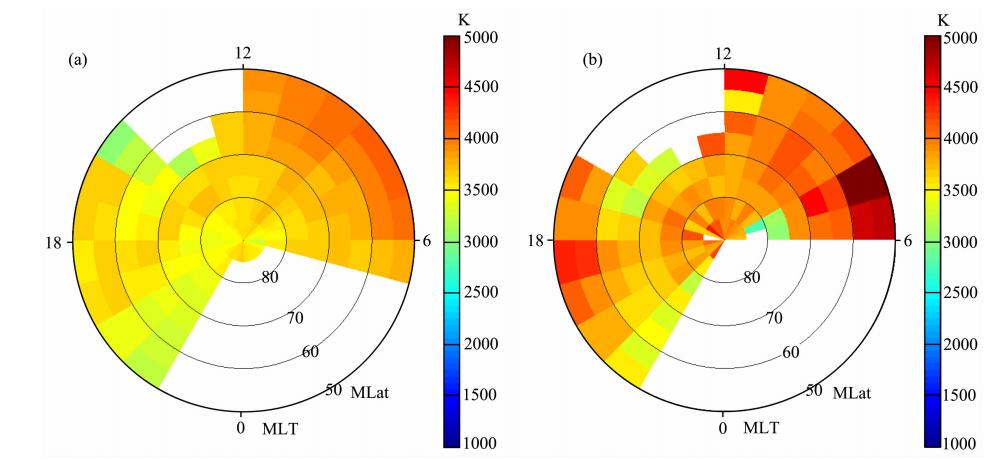 | 图 9 北半球顶部电离层高度,磁暴期间(a)和离子上行期间(b),DMSP卫星观测到电子平均温度的时空分布 Fig. 9 Temporal-spatial distribution of averaged electron temperature during geomagnetic storms(a) and storm-time ion up-flowing events(b)by DMSP F13/15 spacecraft in the Northern Hemisphere |
图 10给出了磁暴期间北半球感兴趣的纬度范围内,与顶部电离层离子上行相联系的电子/离子温度变化比例的MLT分布.将所选磁暴期间各区域内对应的电子/离子平均温度作为参考.
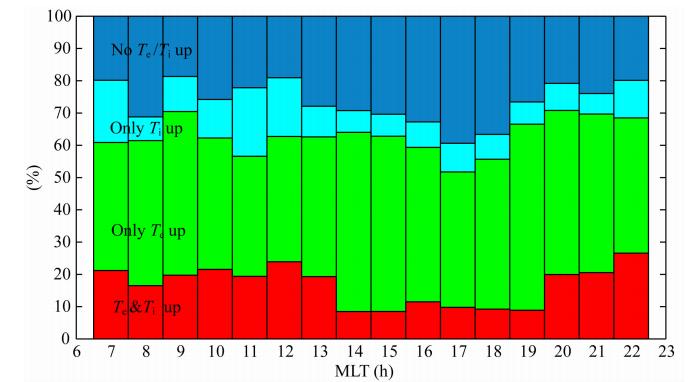 | 图 10 磁暴期间,DMSP卫星在北半球观测到与离子上行相伴随的电子/离子温度不同类型响应的比例随MLT分布 由下至上四种颜色分别代表离子上行期间,(1)电子/离子温度都增加100 K以上;(2)只有电子温度增加100 K以上; (3)只有离子温度增加100 K以上和(4)电子/离子温度变化都小于100 K所占的比例. Fig. 10 MLT distribution of various types of ion/electron temperature response associated with ion up-flow events during geomagnetic storms observed by DMSP F13/15 spacecraft in Northern Hemisphere Red bars present ion/electron temperature both increase more than 100 K in relative to background. Green(cyan)bars indicate that only electron(ion)temperature increased more than 100 K. Blue bars indicate variation of ion/electron temperature both were less than 100 K. |
如图 10所示,磁暴期间,DMSP卫星观测到约15%的离子上行事件伴随着电子/离子的同时增温;在约45%(5%)的上行事件期间,DMSP只观测到电子(离子)增温.总的来看,顶部电离层暴时离子上行期间,DMSP观测到电子增温的比例(含(1)和(2))是离子增温比例(含(1)和(3))的3倍.另外,约35%的离子上行事件期间,DMSP卫星没有观测到电子/离子温度的显著变化.
图 9和图 10表明,磁暴期间,DMSP卫星在极区顶部电离层高度上也频繁地观测到与离子上行相伴随的电子/离子加热,且电子加热发生的频率要远高于离子加热.这表明,软电子沉降引起的电子加热与极区顶部电离层暴时离子上行具有强的相关性.这与基于长期DE-2卫星(Seo et al., 1997)和地面雷达(Ogawa et al., 2009,2010)观测数据的统计结果相一致.可以认为,即使在磁暴期间,软电子沉降引起的电子加热也对顶部电离层离子上行起着重要的驱动作用.
然而,摩擦引起的离子加热对电离层F层400 km以下高度的离子上行加速更为明显(Seo et al., 1997;Keating et al., 1990),而软电子沉降引起的电子加热主要对顶部电离层的离子上行加速更为明显(Seo et al., 1997).受限于运行轨道,DMSP卫星难以获得卫星轨道高度以下的离子加热信息.这在很大程度上调制着图 9和图 10的结果.因此,需要上行离子源区所在高度的信息.
在顶部电离层高度,电离层上行离子通常认为主要是氧离子(O+)(霍亮等,2006).在外力的驱动下,电离层O+从源区沿磁力线上行.通常情况下,在电离层F2峰高以上,O+密度随高度衰减.这样,电离层O+上行期间,上行离子源区内可能出现短时的O+密度耗空;而上行的O+沿磁力线被输运到更高的高度,引起这些高度上O+密度的增加.因此,对离子上行期间O+密度的变化进行分析,将有助于我们获得电离层上行离子源区所在高度的信息.结合这些信息,可以进一步讨论磁暴期间电离层离子上行的可能驱动过程.
图 11a和图 11b分别给出了磁暴期间,DMSP卫星在北半球观测到的与离子上行相伴随的O+密度耗空/增加所占比例的时空分布.将顶部电离层离子上行区域附近的O+密度作为参考.不难看出,在绝大数时空网格内,顶部电离层高度上O+密度耗空的比例(图 11a)都要高于增加的比例(图 11b).这表明,在顶部电离层高度,与磁暴期间离子上行相伴随的更多是O+密度耗空.
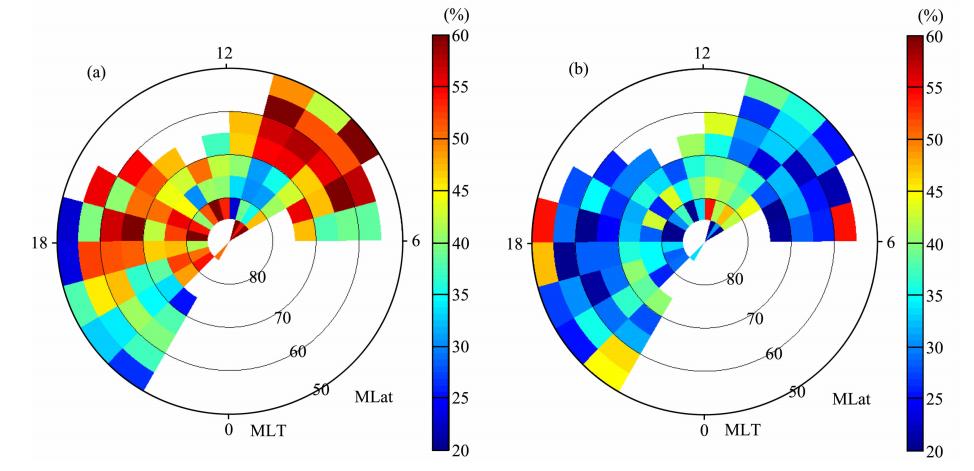 | 图 11 北半球顶部电离层高度,磁暴期间离子上行区域内密度耗空(a)和增加(b)比例的时空分布 Fig. 11 Temporal-spatial distribution of depletion(a) and increase(b)of topside ionospheric density inside up-flowing regions detected by DMSP spacecraft during geomagnetic storms in Northern Hemisphere |
图 12给出了磁暴期间,北半球感兴趣纬度区间内,与离子上行相伴随的电离层O+密度变化比例随MLT的分布.结果显示,在各磁地方时顶部电离层高度,离子上行区域内O+密度耗空发生的比例为~40%,是O+密度增加(~20%)的2倍.
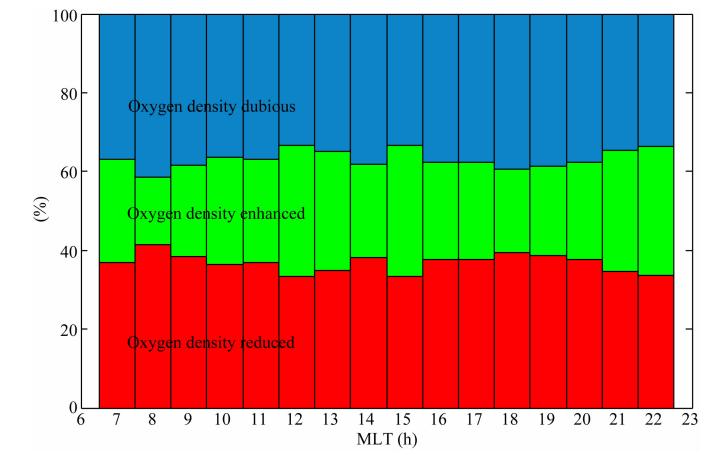 | 图 12 北半球磁暴期间,与顶部电离层离子上行相伴随O+密度变化比例的MLT分布 红色、绿色、蓝色分别代表O+密度的耗空、增加和不确定. Fig. 12 MLT distribution of various types of O+ density response associated with ion up-flow events during geomagnetic storms observed by DMSP F13/15 spacecraft in Northern Hemisphere Red bar indicates O+ density depletion. Green bar indicates increase of O+ density. Blue bar indicates dubious variation of O+ density. |
图 12结果还表明,存在~40%的离子上行事件,与这些事件相伴随的顶部电离层O+密度变化不确定.可能的解释有(1)上行O+来自于低高度源区,但对顶部电离层O+密度的贡献还不明显;或者(2)上行O+源区位于顶部电离层,但引起的O+密度耗空还不显著.
软电子沉降除了加热当地电子、使电子温度升高之外,还会引起热层中性成分电离,生成新的电子和离子.在电离层F2峰值高度以上,随着高度的升高,原子氧和氢依次成为热层的主导成分.氧原子与沉降的软电子碰撞后被电离,在顶部电离层高度生成自由电子和O+.这些新产生的O+客观上会引起当地O+密度的增加,部分弥补因离子上行导致的源区O+密度耗空,或增强源区以上高度O+密度的增加.考虑到这些因素,实际因离子上行导致顶部电离层高度O+密度耗空(增加)的比例应高于(低于)图 11和图 12的结果.
综上所述,磁暴期间,DMSP卫星观测到的上行O+更多地源自于顶部电离层.这表明顶部电离层的电子增温是暴时离子上行重要驱动.这与离子上行期间频繁的电子增温(图 9和图 10)是一致的.磁暴期间,源自磁层的软电子沉降至顶部电离层高度,加热当地电子,使得电子温度升高,增强双极电场,从而驱动离子上行;在上行离子源区,电离层O+得不到及时的补充,形成短时的O+密度耗空.
5 总结本文利用DMSP F13和F15卫星在58个磁暴(-472 nT≤Dst≤-71 nT)期间的观测数据,对高纬顶部电离层暴时离子上行特征进行了统计分析.结果概括如下:
(1)离子上行主要发生在极尖区和夜间极光椭圆区.DMSP卫星在北半球观测到两个离子上行高发区,一个出现在磁正午前后,另一个出现在磁傍晚.在南半球,离子上行也表现出两个高发区:一个出现在磁傍晚;另一个出现在磁午夜前后.
(2)在北半球,高速的离子上行(>500 m·s-1)磁正午前多集中出现在65° MLat以上区域;午后向低纬度扩展,其上行速度要略高于磁正午前.在南半球,磁午夜前,DMSP卫星在考察区域内几乎所有的纬度上都观测到了高速上行的离子;午夜后,各纬度上观测到上行离子的速度明显降低.
(3)磁暴期间,离子上行区域的纬度跨度表现出明显的时空分布,在北半球极光椭圆0900MLT附近,离子上行区的纬度跨度超过3°;在南半球极光椭圆区及极盖区,离子上行区域相对较窄,在约0.5°~1°间变化.
(4)在暴时顶部电离层高度,电子增温和O+密度耗空都表现出与离子上行较高的相关性,表明电子增温在驱动暴时顶部电离层离子上行过程中起重要作用.
致谢 感谢美国宇航局戈德太空飞行中心和达拉斯德克萨斯大学(uTD)空间科学中心通过互联网络 http://cindispace.utdallas.edu/DMSP/提供DMSP卫星数据.
| [1] | Abe T, Whalen B A, Yau A W, et al. 1993. EXOS D (Akebono) suprathermal mass spectrometer observations of the polar wind. J. Geophys. Res., 98(A7): 11191-11203. |
| [2] | Andersson L, Peterson W K, McBryde K M. 2004. Dynamic coordinates for auroral ion outflow. J. Geophys. Res., 109(A8), doi: 10.1029/2004JA010424. |
| [3] | André M, Norqvist P, Vaivads A, et al. 1994. Transverse ion energization and wave emissions observed by the Freja satellite. Geophys. Res. Lett., 21(17): 1915-1918. |
| [4] | André M, Yau A. 1997. Theories and observations of ion energization and outflow in the high latitude magnetosphere. Space Sci. Rev., 80(1-2): 27-48. |
| [5] | Chappell C R, Giles B L, Moore T E, et al. 2000. The adequacy of the ionospheric source in supplying magnetospheric plasma. J. Atmos. Sol.-Terr. Phys., 62(6): 421-436. |
| [6] | Coley W R, Heelis R A. 1998. Seasonal and universal time distribution of patches in the northern and southern polar caps. J. Geophys. Res., 103(A12): 29229-29237. |
| [7] | Coley W R, Heelis R A. 2009. Stormtime measurements of topside ionospheric upflow from Defense Meteorological Satellite Program. J. Geophys. Res.: Space Physics (1978-2012), 114(A10), doi: 10.1029/2009JA014350. |
| [8] | Cully C M, Donovan E F, Yau A W, et al. 2003. Akebono/Suprathermal Mass Spectrometer observations of low-energy ion outflow: Dependence on magnetic activity and solar wind conditions. J. Geophys. Res., 108(A2), doi: 10.1029/2001JA009200. |
| [9] | Ebihara Y, Yamada M, Watanabe S, et al. 2006. Fate of outflowing suprathermal oxygen ions that originate in the polar ionosphere. J. Geophys. Res., 111(A4), doi: 10.1029/2005JA011403. |
| [10] | Endo M, Fujii R, Ogawa Y, et al. 2000. Ion upflow and downflow at the topside ionosphere observed by the EISCAT VHF radar. Ann. Geophys., 18(2): 170-181. |
| [11] | Finlay C C, Maus S, Beggan C D, et al. 2010. Evaluation of candidate geomagnetic field models for IGRF-11. Earth Planets and Space, 62(10): 787-804. |
| [12] | Frank L A, Ackerson K L, Yeager D M. 1977. Observations of atomic oxygen (O+) in the earth's magnetotail. J. Geophys. Res., 82(1): 129-134. |
| [13] | Ganguli G, Keskinen M J, Romero H, et al. 1994. Coupling of microprocesses and macroprocesses due to velocity shear: An application to the low-altitude ionosphere. J. Geophys. Res., 99(A5): 8873-8889. |
| [14] | Hairston M R, Heelis R A. 1993. High-latitude electric field studies using DMSP data. Texas Univ at Dallas Richardson Center for Space Sciences. |
| [15] | Heelis R A, Hairston M R. 1990. Studies of ionospheric dynamics utilizing data from DMSP. Texas Univ at Dallas Richardson Center for Space Sciences. |
| [16] | Heelis R A, Bailey G J, Sellek R, et al. 1993. Field-aligned drifts in subauroral ion drift events. J.Geophys.Res., 98(A12): 21493-21499. |
| [17] | Horwitz J L, Moore T E. 1997. Four contemporary issues concerning ionospheric plasma flow to the magnetosphere. Space Sci. Rev., 80(1-2): 49-76. |
| [18] | Huddleston M M, Chappell C R, Delcourt D C, et al. 2005. An examination of the process and magnitude of ionospheric plasma supply to the magnetosphere. J. Geophys. Res., 110(A12), doi: 10.1029/2004JA010401. |
| [19] | Huo L, Ma S Y, Zhou Y L, et al. 2006. Ion upflow in the topside polar ionosphere-observations by the DMSP satellite. Chinese Journal of Polar Research (in Chinese), 18(2): 98-107. |
| [20] | Keating J G, Mulligan F J, Doyle D B, et al. 1990. A statistical study of large field-aligned flows of thermal ions at high-latitudes. Planet. Space Sci., 38(9): 1187-1201. |
| [21] | Liu C, Horwitz J L, Richards P G. 1995. Effects of frictional ion heating and soft-electron precipitation on high-latitude F-region upflows. Geophys. Res. Lett., 22(20): 2713-2716. |
| [22] | Liu H X, Ma S Y, Schlegel K. 2001. Diurnal, seasonal, and geomagnetic variations of large field-aligned ion upflows in the high-latitude ionospheric F region. J. Geophys. Res., 106(A11): 24651-24661. |
| [23] | Liu H, Lu G. 2004. Velocity shear-related ion upflow in the low-altitude ionosphere. Ann. Geophys., 22(4): 1149-1153. |
| [24] | Loranc M, Hanson W B, Heelis R A, et al. 1991. A morphological study of vertical ionospheric flows in the high-latitude F region. J. Geophys. Res., 96(A3): 3627-3646. |
| [25] | Moore T E, Lundin R, Alcayde D, et al. 1999. Source processes in the high-latitude ionosphere. Space Sci. Rev., 88(1-2): 7-84. |
| [26] | Moore T E, Horwitz J L. 2007. Stellar ablation of planetary atmospheres. Rev. Geophys., 45(3), doi: 10.1029/2005RG000194. |
| [27] | Nilsson H, Barghouthi I A, Slapak R, et al. 2013. Hot and cold ion outflow: Observations and implications for numerical models. J. Geophys. Res., 118: 105-117. |
| [28] | Nosé M, Ohtani S, Takahashi K, et al. 2001. Ion composition of the near-Earth plasma sheet in storm and quiet intervals: Geotail/EPIC measurements. J. Geophys. Res., 106(A5): 8391-8403. |
| [29] | Nosé M, McEntire R W, Christon S P. 2003. Change of the plasma sheet ion composition during magnetic storm development observed by the Geotail spacecraft. J. Geophys. Res., 108(A5): 1201, doi: 10.1029/2002JA009660. |
| [30] | Nosé M, Taguchi S, Hosokawa K, et al. 2005. Overwhelming O+ contribution to the plasma sheet energy density during the October 2003 superstorm: Geotail/EPIC and IMAGE/LENA observations. J. Geophys. Res., 110(A9), doi:10.1029/2004JA010930. |
| [31] | Ogawa Y, Buchert S C, Fujii R, et al. 2009. Characteristics of ion upflow and downflow observed with the European Incoherent Scatter Svalbard radar. J. Geophys. Res., 114(A5), doi: 10.1029/2008JA013817. |
| [32] | Ogawa Y, Buchert S C, Sakurai A, et al. 2010. Solar activity dependence of ion upflow in the polar ionosphere observed with the European Incoherent Scatter (EISCAT) Tromsø UHF radar. J. Geophys. Res., 115(A7), doi: 10.1029/2009JA014766. |
| [33] | Øieroset M, Yamauchi M, Liszka L, et al. 1999. Energetic ion outflow from the dayside ionosphere: Categorization, classification, and statistical study. J. Geophys. Res., 104(A11): 24915-24927. |
| [34] | Peterson W K, Collin H L, Lennartsson O W, et al. 2006. Quiet time solar illumination effects on the fluxes and characteristic energies of ionospheric outflow. J. Geophys. Res., 111(A11), doi: 10.1029/2005JA011596. |
| [35] | Seo Y, Horwitz J L, Caton R. 1997. Statistical relationships between high-latitude ionospheric F region/topside upflows and their drivers: DE 2 observations. J. Geophys. Res., 102(A4): 7493-7500. |
| [36] | Shelley E G, Johnson R G, Sharp R D. 1972. Satellite observations of energetic heavy ions during a geomagnetic storm. J. Geophys. Res., 77(31): 6104-6110. |
| [37] | Skjæveland Å, Moen J, Carlson H C. 2011. On the relationship between flux transfer events, temperature enhancements, and ion upflow events in the cusp ionosphere. J. Geophys. Res., 116(A10): A10305, doi: 10.1029/2011JA016480. |
| [38] | Strangeway R J, Ergun R E, Su Y J, et al. 2005. Factors controlling ionospheric outflows as observed at intermediate altitudes. J. Geophys. Res., 110(A3), doi: 10.1029/2004JA010829. |
| [39] | Su Y J, Caton R G, Horwitz J L, et al. 1999. Systematic modeling of soft-electron precipitation effects on high-latitude F region and topside ionospheric upflows. J. Geophys. Res., 104(A1): 153-163. |
| [40] | Tam S W Y, Chang T, Pierrard V. 2007. Kinetic modeling of the polar wind. J. Atmos. Sol.-Terr. Phys., 69(16): 1984-2027. |
| [41] | Whitteker J H. 1997. The transient response of the topside ionosphere to precipitation. Planet. Space Sci., 25(8): 773-786. |
| [42] | Wu X Y, Horwitz J L, Seo Y. 2000. Statistical analysis of F region and topside ionospheric ion field-aligned flows at high latitudes. J. Geophys. Res., 105(A2): 2477-2494. |
| [43] | Yau A W, Peterson W K, Abe T. 2011. Influences of the ionosphere, thermosphere and magnetosphere on ion outflows. //Liu W, Fujimoto M. The Dynamic Magnetosphere. Netherlands: Springer, 283-314. |
| [44] | Yeh H C, Foster J C. 1990. Storm time heavy ion outflow at mid-latitude. J. Geophys. Res., 95(1): 7881-7891. |
| [45] | 霍亮, 马淑英, 周云良等. 2006. 极区顶部电离层离子上行——DMSP卫星观测. 极地研究, 18(2): 98-107. |
 2014, Vol. 57

