 2014, Vol. 57


2. 中国科学院计算地球动力学重点实验室, 北京 100049
2. Key Laboratory of Computational Geodynamics, Chinese Academy of Science, Beijing 100049, China
地震是岩石的黏滑摩擦失稳过程(Brace & Byerlee,1966),大多数构造地震起因于原有断层(或板块边界)的突然滑动,而很少是突然产生新的剪切破裂(或断层)(Scholz, 1998).由于地震时断层破裂空间尺度巨大并且在无法直接探测的地下深处,数值模拟地震的发生过程对于认识地震的物理本质,直至定量预报地震,都有着重大的科学意义和实际应用价值.
目前,有多种数值方法模拟地震过程或断层的自发破裂过程,其中较常见的有:有限差分法(如:Andrews, 1973; Day, 1982; Madariaga et al., 1998; Andrews, 1999; Dalguer & Day, 2007; Ely et al., 2009; Zhang et al., 2010), 有限单元法(如:Oglesby et al, 1998, 2000, 2008; 蔡永恩等,1999;Cai et al, 1999, 2000; Aagaard et al., 2001; 陈祖安等,2003),边界积分方程法(如:Das, 1980; Andrews, 1985; Cochard & Madariaga, 1994; Aochi et al., 2000; Lapusta et al., 2000; Chen & Zhang, 2006; Zhang & Chen, 2006),等.
通过以上方法的研究,加深了我们对地震破裂物理过程的认识.然而不同的方法都存在着优点和缺点,如:有限差分法数学方法简明,计算精度高,容易在计算机上实现;尽管近年来该方法得到不断改善,但在一般情况下对材料非线性、大变形、非平面断层及不规则的几何边界问题还是不易处理,并且对于显式解法其解的稳定性是有条件的.边界积分法计算效率高、精度好,能够比较灵活地处理复杂的断层系统及边界,但较难处理材料的不均匀性及材料的非线性问题(蔡永恩等,1999).
有限单元方法对解决不连续介质力学问题非常有效,这种方法很容易实现模拟介质的非均匀性、几何非线性和物理非线性.近10多年来,由于有限元方法的不断改进以及超级计算设备成本的下降,利用有限单元方法研究地震破裂过程受到国内外研究人员的广泛重视,取得了许多研究成果(如: Oglesby et al., 1998; Aagaard et al., 2001; Duan & Oglesby, 2005; Oglesby et al., 2008; Olsen-Kettle et al., 2008; Duan, 2010; Pelties et al., 2012; Zhu & Zhang, 2013).
此外,通过研究发现断层上的摩擦本构关系是控制断层破裂过程的重要因素(Scholz, 1998).然而实际地震时,断层上的摩擦关系是极其复杂的 (Tse & Rice, 1986; Dieterich, 1994; Scholz, 1998; Scholz, 2002); 不仅如此,实际地震时断层破裂过程中的摩擦关系根本无法直接测量,因此断层上摩擦关系的选定是研究断层自发破裂过程中的关键问题.值得庆幸的是,岩石力学实验建立了许多摩擦定律,与动力摩擦实验符合得最好的就是速率-状态相关的Dieterich-Ruita定律(Dieterich, 1978, 1979; Johnson, 1981; Ruina, 1983; Marone, 1998; Scholz, 1998).该定律描述了摩擦系数随着滑移速率及状态的变化而变化,利用该定律可以模拟断层的自发破裂过程(Rice& Ben-Zion, 1996; Tullis,1996; Ben-Zion, 2001; Hillers et al., 2006; 朱守彪,2008,2009;Zhu & Zhang, 2010, 2013). 然而,Dieterich-Ruita摩擦关系是在低滑移速率(10-7~1 mm/s)的实验环境里得出的结果,而实际大地震的滑移速率 一般在~m/s(米/秒)的量级(Heaton, 1990; Somerville et al., 1999; Aagaard et al., 2001). 因此,Dieterich-Ruita摩擦定律能否直接用于研究实际地震的破裂过程,还不是很清楚(Lapusta, 2001).由于实际断层破裂动力过程的极其复杂,加上摩擦关系又无法直接测量,所以目前用于模拟断层自发破裂过程 的摩擦本构关系都是从实验室结果外推的(Bizzarri,2011,2012).
尽管不同的研究者偏向不同的摩擦本构关系,但大多数模拟工作者都取形式上简单、又能够模拟 复杂破裂过程的滑移弱化摩擦本构关系(如:Oglesby et al., 2008; Olsen-Kettle et al., 2008; Viesca et al., 2008; Templeton et al, 2008, 2010; Aochi & Kato, 2010, Duan, 2012; Lozos et al., 2012).但在实际应用时发现,该摩擦关系存在一些不足(如当滑移超过临界滑移距离后,摩擦系数就不会变化,一直维持在动摩擦系数).因此,本文首先将这种简单的滑移弱化摩擦本构关系进行改进,然后来模拟实际断层的自发破裂过程.
另外,不少前人的研究侧重于实验室尺度(如:Shi et al., 2008;Lu et al., 2010),而实际地震的断层破裂尺度在数十到数百千米(如汶川地震地表破裂350 km(朱守彪和张培震,2009),2011日本大地震地表破裂440 km(Ide et al., 2011)),甚至超过1000 km (如:2004年的印尼大地震地表破裂为1200 km(McCloskey et al., 2005)).所以,本文利用有限元方法按照实际天然地震的尺度来研究断层破裂的动力学过程,考察初始应力场及摩擦关系的变化对断层破裂特征的影响.
为研究断层自发破裂过程的物理本质,文中将实际地震过程的三维情况抽象为二维模型,断层由实际的弯曲、拐折、阶跃(stepover)等复杂情况简化为一条直线(见图1).图1为研究所用的模型几何及初始、边界条件.由图可见,模型空间几何为100 km×100 km的正方形,直线AB为断层所在位置,其中L为成核区,其长度Lnucl=2 km.为防止地震波通过边界反射而影响结果,四周采用吸收边界(Clayton & Engquist, 1977).此外,在整个区域内 施加初始应力场并在外部边界Γ上加载统一的正 应力σ和剪应力τ.
 | 图1 模型的几何及初始、边界条件 模型几何为100 km×100 km的正方形.图中直线AB表示断层位置,箭头所指的粗黑线L为成核区,其长度为Lnucl=2 km. Fig.1 Model geometry, the initial and boundary conditions The model domain is 100 km by 100 km. Line AB in the figure is the location of fault, the bold black line L to which the arrow points is the nucleation zone, its length is Lnucl= 2 km. |
模型全部采用三节点单元来剖分.利用此单元可完全消除沙漏现象对模型计算产生的影响(Hibbitt et al., 2012).断层中间的40 km部分为研究的重点区域,为了保证精度,在该区域对网格进行细化,单元边长为100 m.此外,随着离开断层距离的增大,单元的尺度也越来越大,模型最外围部分单元的边长为500 m(见图2).模型中三角形单元的节点数及单元总数分别为138,348、274,612.
 | 图2 模型网格 模型中间部分网格细密,单元边长为100 m.由内向外网格逐渐由细变粗,最外围部分单元的边长为500 m. Fig.2 Map of finite element meshes in the model The meshes in the middle of the model are densely distributed, and become coarse gradually outwards. The length of the element is 100 m at the center of the model, and it is 500 m at the peripheral part of the model. |
模型使用的控制方程与Templeton & Rice(2008)及Viesca等(2008)所使用的基本相同.利用有限元方法研究被断层隔开的两块区域间的破裂动力学过程,即整个区域内求解二维波动方程(王勖成,2003):

式中σij是应力张量,fi是体力,ρ是弹性介质的密度,c是阻尼系数,ui表示位移,ui,t和ui,tt分别是ui对t的一次导数和二次导数,即分别是速度和加速度;-ρui,tt和-cui,t分别代表惯性力和阻尼力,因此方程(1)称为平衡方程,在线弹性介质中

式中λ和μ为拉梅常数,称为物理方程.
将平衡方程(1)及力的边界条件表示成等效积分形式,可以得到虚功原理的矩阵表达形式(王勖成,2003):
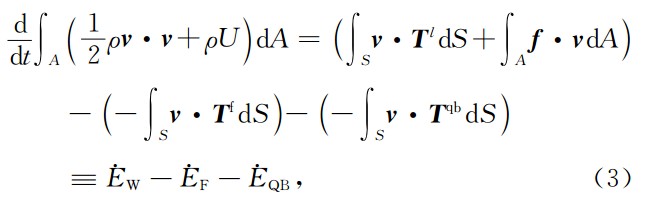
式中t为时间,ρ为弹性介质的密度, v 为速率矢量,U为单位质量的内能, f 为体力, T l为边界分布荷载, T qb为吸收边界上吸收辐射能量的阻尼力, T f为摩擦力,E · W为外力做功功率,E · F为摩擦耗散吸收功率,E · QB为吸收边界上阻尼耗散功率.
离散后的位移表达式代入(3)式,得到求解域内有限元节点位移满足的运动方程:

式中 ü (t)、 u · (t)和 u (t)分别是系统的节点加速度向量、节点速度向量和节点的位移向量. M,C,K和Q (t) 分别是系统的质量矩阵、阻尼矩阵、刚度矩阵、和节点荷载向量.式中:

式中 F t(t)和 F f(D(t),D · (t))分别表示构造力和断层面上的接触力,D表示断层上的相对滑移距离,D · 表示断层上的相对滑移速率.实际计算中,运用有限元中的接触技术来模拟断层的运动.
在断层两侧法向位移假设满足连续条件:

此外假设断层面上应力满足(Zienkiewicz et al., 2005):
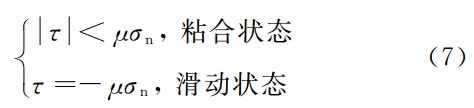
式中σn为法向接触应力,τ为切向应力,μ为摩擦系数.
利用方程(4)—(7)就可以得到地震位移场.
断层上的摩擦关系非常复杂 (Tse & Rice, 1986; Scholz, 2002; Dieterich, 1994; Scholz, 1998).前人已尝试使用多种类型的摩擦关系来模拟断层的自发破裂过程(Lapusta et al., 2000; Shi et al, 2008, 2008).但是,在所有类型的摩擦关系中,滑移弱化的摩擦本构关系由于其形式简单且易于实 现得到非常广泛的应用.这种摩擦关系最初是由Ida(1972)、Palmer & Rice (1973)及Andrews(1976a,1976b)提出.后来,Ohnaka等(1989,1993,1996, 1999)也在实验研究中证实了断层上的摩擦系数随断层两侧相对滑移距离增大而减小的真实性.在这种摩擦关系中,当断层两侧的相对滑移距离达到特征滑移距离后,断层上的摩擦系数将一直不变,维持动摩擦系数状态,这样破裂不会停止.因此Lu(2010) 通过实验研究指出,利用经典的滑移弱化的摩擦关系,断层在发生自发破裂时将不能产生脉冲型(pulse-like)破裂模式,即断层一旦发生破裂后就根本无法愈合(healing).所以,为克服滑移弱化 摩擦关系的不足,文中对这种摩擦关系进行了改 进.具体做法是:当断层面上两节点之间在滑移过程中若其相对滑移速度接近为零,即两节点之间相对不再有明显滑移时,其摩擦系数取为静摩擦系数(μs).
经典的滑移弱化摩擦本构关系的数学表达式如 下(Ida, 1972; Palmer & Rice (1973); Andrews, 1976a, 1976b):
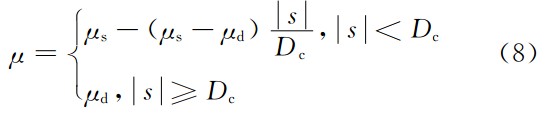
式中μs为静摩擦系数,μd为动摩擦系数, s 为断 层面上两点之间的相对滑移距离,Dc为特征滑移距离.
由于本文重点是研究初始应力状态及摩擦关系对破裂过程的影响,因此为简单起见,模型中的介质选取为各向同性的线弹性材料.
对于平面应变问题,材料的P波速度(α)、S波速度(β)、瑞利波速度(CR)与杨氏模量E、泊松比ν和密度ρ的关系如下(Shi at el., 2008):
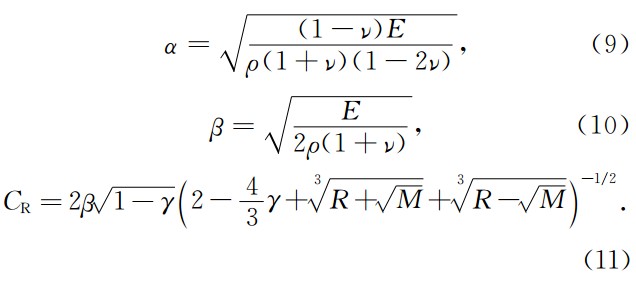
式中:
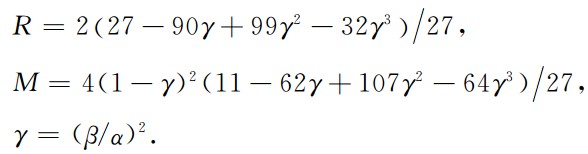
模型中杨氏模量取为E= 7.5×10¹⁰ Pa、泊松比ν= 0.28和密度ρ=2700 kg/m3,由上述公式 计算可得α= 5959 m/s,β=3294 m/s,CR=3045 m/s.
同前人的研究一样(如:Shi at el., 2008;Olsen-Kettle et al.,2008), 本研究通过成核来实现断层的自发破裂过程.为让断层能够产生自发破裂行为,模型在断层中央设置了成核区(见图1).通常成核区为断层上一小段特殊区域(patch),这段区域的应力状态在发生破裂开始前就已达到或超过破裂准则所要求的临界状态(Olsen-Kettle et al.,2008).因此,在一开始成核区断层两侧会产生缓慢滑移(非常小的位错),而断层上其他区域保持闭锁状态(没有明显的位错).但随着成核区位错的产生,改变了整个断层上的应力状态,特别是成核区附近断层上的摩擦系数会减小(滑移弱化的摩擦关系决定的),当成核区附近断层上的应力状态符合库仑破裂准则时,该区域断层会自发滑动,产生位错;如此下去导致整个断层破裂.显然,成核过程对断层破裂行为有重要的作用.实际上,成核区的大小及不同的成核过程将 对断层的破裂行为产生重要的影响(Shi at el., 2008).
时间积分方法是非线性有限元计算中的重要方面,为保证计算精度,同时兼顾计算速度,模拟计算 中采用中心差分的时间积分方法(有限元显式算法).
由于中心差分法是条件稳定算法(王勖成,2003),即时间步长Δt必须小于所求解方程性质所决定的某个临界值Δtcr.Δtcr的大小可以通过公式Δtcr=L/(E/ρ)1/2来近似估算(式中L为模型中尺 度最小单元的最小边长).经过计算,本模型中 Δtcr≈ 0.019 s.文中实际计算中所采用的时间步长为1.0×10⁻⁴s, 远小于0.019 s的临界值,因而满足中心差分法的稳定性条件.由此可见,文中的计算过程是稳定、收敛的,计算精度能够满足要求.
本文利用ABAQUS/Explicit商业有限元软件(有限元显式计算程序)(Hibbitt et al., 2012)来模拟断层破裂的动力学过程,并且使用有限元分析中的接触单元技术来描述不连续断层的动力学行为,具体计算中是调用ABAQUS中的VFRIC用户子 程序进行二次开发来实现模拟断层的自发破裂过程.
实际地震过程中,断层两侧质点运动速度、破裂传播速度及破裂模式是变化的.早期研究认为断层自发破裂行为主要是裂纹型破裂模式(如:Kostrov, 1966; Ida, 1972; Andrews, 1976; Madariaga, 1976),这种破裂模式的特点是:破裂面上各点位错的持续时间与整个破裂过程持续的时间相当.然而,后来的地震反演研究表明断层的破裂过程可能是脉冲型破裂模式(如: Kanamori & Anderson, 1975; Heaton, 1990),即破裂面上各点位错的持续时间比整个破裂过程持续的时间小得多.人们已经在实验室环境下及数值模拟研究中均证明了这两种破裂模式都可以存在的可能性(Olsen-Kettle et al., 2008; Shi et al., 2008; Lu et al., 2010).
下面将重点研究模型在不同的初始场及不同的摩擦关系情况下,是产生脉冲型破裂还是产生裂纹型破裂.根据不同情况下的初始应力状态及不同摩擦本构关系,这里有4种不同情形的模拟结果(分别称为4种模型).
在模型1中,初始应力场为:σ=100 MPa,τ=54 MPa;滑移弱化摩擦本构关系中的参数如下,μs=0.6,μd= 0.52,Dc=0.1 m.
在上述条件下,断层首先在成核区开始出现滑移,然后逐步向左右两侧产生自发破裂.图3是断层两侧的相对滑移距离随时间的变化情况.从图中可以看出,断层上各点在开始破裂后不久两边的相对滑移距离便保持不变,断层上的最大滑移距离为0.57 m(成核区附近除外);此外,滑移以断层中心呈对称分布.图4给出了断层两侧相对滑移速率随 时间的变化,图中显示断层上各点在开始破裂后不 久,相对运动速率即降低至0,亦即破裂后断层很快就愈合,这是典型的脉冲型破裂模式.图5显示的是离断层中心右边10 km处的断层上的剪切应力、相对滑移距离、相对滑移速率随时间的变化情况.图5a显示断层上的剪切应力在t=1.5 s时开始慢慢增大,在t=2.8 s时上升幅值达~1 MPa,然后缓慢下降到初始值附近,徘徊一小段时间(~0.3 s)后突然增大,在t=3.45 s达到峰值(~60 MPa);但接着很快就下降到初始值以下;持续一段时间(~1 s)后,逐渐回到初始应力状态.图5b中可见在t=3.45 s滑移距离开始增大,到t=4.4 s时滑移距离不再随时间变化,保持稳定不变.图5c中可见在t=3.45 s时滑移突然由0变化到峰值(~2.0 m/s), 然后很快振荡下降直到停止(t=4.4 s);所以该处滑移过程持续的时间为~1 s, 远远低于整个破裂的持续时间,这是脉冲型破裂模式的特征.对照图5a、5b及5c可以看出,断层上剪切应力的变化最先出现,尽管有一定的应力增加,但在没有到达临界应力前,断层仍处于闭锁状态,断面上的滑移为0.在剪切应力达到峰值,超过库仑破裂准则的阈值后,断层开始滑移,经过极短时间,其滑移速度就达到峰值.由于采用的是滑移弱化的摩擦关系,所以一旦断层开始滑移,摩擦系数就减小,滑移超过临界滑移距离(Dc)时,摩擦系数变为动摩擦系数(μd), 与此对应的剪切应力也迅速减小(低于初始值, 见图5a),导致滑移速率快速变小,直至为0,摩擦系数增大为静摩擦系数,相对滑移停止增大.
 | 图3 模型1中断层两侧相对滑移距离随时间的变化 x轴表示沿断层距离,y轴表示滑移距离,z轴表示时间;断层上的破裂由中心不断向两边延伸且断层上各点在开始破裂后不久两边的相对滑移距离便保持不变. Fig.3 Snapshots of the slip profiles along the interface at various times for Model 1 The x-axis represents the distance along the fault, y-axis denotes the slip, and z-axis stands for time. Rupture on the fault continuously extends out from the center of the fault in both opposite directions, and the relative slip on the fault will remain unchanged shortly after the rapture initiates. |
 | 图4 模型1中断层两侧相对滑移速率随时间的变化 x轴表示沿断层距离,y轴表示滑移速率,z轴表示时间;断层上的破裂由中心不断向两边延伸且断层上各点在开始破裂后不久两边的相对滑移速率便降低至零. Fig.4 Snapshots of the slip-rate profiles along the interface at various times for Model 1 The x-axis represents the distance along the fault, y-axis denotes the slip-rate, and z-axis stands for time. Rupture on the fault continuously extends out from the center of the fault in both opposite directions, and the relative slip rate on the fault will reduce to zero shortly after the rapture initiates. |
 | 图5 模型1断层上一典型点的剪切应力、滑移距离、滑移速率随时间的变化 (a)表示 断层上的剪切应力随时间的变化,断层上的剪切应力在t=1.5 s 时开始慢慢增大,在t=2.8 s时上升幅值达 ~1 MPa,然后缓慢下降到初始值附近,徘徊一小段时间(~0.3 s)后突然增大,在t=3.45 s达到峰值(~60 MPa);但接着很快就下降到初始值以下;持续一段时间(~1 s)后,逐渐回到初始应力状态;(b)为滑移距离随时间的变化,在t=3.45 s滑移距离开始增大,到t=4.4 s时滑移距离不再随时间 变化,保持稳定不变;(c)为滑移速率随时间的变化,在t=3.45 s时滑移突然由0变化到峰值(~2.0 m/s), 然后很快振荡下降直到停止(t=4.4 s). Fig.5 Shear stress, sliding distance, and slip velocity at a typical point on the fault vary with time in Model 1 (a) shows the changes of shear stress with time. The shear stress on the fault begin to increase slowly at 1.5 s, come to the value of ~1 MPa at 2.8 s, then fall slowly near to the initial value, suddenly increase after wandering a short period of time (~0.3 s), and go to the peak value at time of 3.45 s (~60 MPa). However, after a while, the shear stress falls below the initial value, but it gradually turn back to the initial state after a short period of time (~1 s). (b) shows the sliding distance varies with time. The sliding distance begins to increase at time of 3.45 s, and it keeps constant at time of 4.4 s. (c) shows the slip-rate changes with time. The slip-rate suddenly increases to peak value (~ 2.0 m/s) from 0 at 3.45 s, and then it quickly declines in oscillation, and finally stop at time of 4.4 s. |
值得特别指出的是,我们清楚地看到模型1中确实出现了脉冲型破裂模式,这正是将滑移弱化摩擦关系进行改进的结果.不然利用经典的滑移弱化摩擦关系将不能产生脉冲型破裂模式(Lu,2010) .
此外,由断层的长度及整个破裂过程的时间可以计算得出平均破裂速度为2898 m/s,低于S波传播速度,属于亚剪切波速度破裂.
在模型2中,初始应力场为:σ=100 MPa,τ=56 MPa;摩擦本构关系中的参数如下,μs= 0.6,μd=0.55,Dc=0.1 m.
在上述条件下,断层首先在成核区开始出现滑移,然后逐步向左右两侧产生自发破裂.图6是断层 两侧的相对滑移距离随时间的变化情况.从图中可以看出,断层上各点在开始破裂后不久两边的相对滑移距离便保持不变,断层上的最大滑移距离为0.32 m(成核区附近除外);此外,滑移以断层中心呈对称分布.图7给出了断层两侧相对滑移速率随时间的变化,图中显示断层上各点在开始破裂后不久,质点运动速率即降低至0,亦即破裂后断层很快就愈合, 这是典型的脉冲型破裂模式.图8显示的是离断层中心右边10 km 处的断层上的剪切应力、相对滑移距离、相对滑移速率随时间的变化情况.对照图8a、8b及8c可以看出,在剪切应力达到峰值,超过库仑破裂准则的阈值后,断层开始滑移,此时摩擦系数逐渐减小,当滑移超过临界滑移距离(Dc)时,摩擦系数为动摩擦系数(μd), 与此对应的摩擦力也迅速减小(低于初始值, 见图8a),导致滑移速率快速变小,直至为0.此外,由断层的长度及整个破裂过程的时间可以计算得出 平均破裂速度为2857 m/s,属于亚剪切波速度破裂.
 | 图6 模型2中断层两侧相对滑移距离随时间的变化 x轴表示沿断层距离,y轴表示滑移距离,z轴表示时间;断层上的破裂由中心不断向两边延伸且断层上各点在开始破裂后不久两边的相对滑移距离便保持不变. Fig.6 Snapshots of the slip profiles along the interface at various times for Model 2 The x-axis represents the distance along the fault, y-axis denotes the slip, and z-axis stands for time. Rupture on the fault continuously extends out from the center of the fault in both opposite directions, and the relative slip on the fault will remain unchanged shortly after the rapture initiates. |
 | 图7 模型2中断层两侧相对滑移速率随时间的变化 x轴表示沿断层距离,y轴表示滑移速率,z轴表示时间;断层上的破裂由中心不断向两边延伸且断层上各点在开始破裂后不久两边的相对滑移速率便降低至零. Fig.7 Snapshots of the slip-rate profiles along the interface at various times for Model 2 The x-axis represents the distance along the fault, y-axis denotes the slip-rate, and z-axis stands for time. Rupture on the fault continuously extends out from the center of the fault in both opposite directions, and the relative slip rate on the fault will reduce to zero shortly after the rapture initiates. |
 | 图8 模型2断层上一典型点的剪切应力、滑移距离、滑移速率随时间的变化 (a)表示断层上的剪切应力随时间的变化,断层上的剪切应力在t=1.5 s 时开始慢慢增大,在t=2.8 s时上升幅值达~1.5 MPa,然后缓慢下降到初始值以下,再逐渐增大,增大速度逐渐加快,在t=3.43 s达到峰值(~60 MPa);但接着很快就下降到初始值以下;持续一段时间(~1 s)后,逐渐回到初始应力状态;(b)为滑移距离随时间的变化,在t=3.43 s滑移距离开始增大,到t=4.44 s时滑移距离不再随时间变 化,保持稳定不变;(c)为滑移速率随时间的变化,在t=3.43 s时滑移突然由0变化到峰值(~1.0 m/s),然后很快振荡下降直到停止(t=4.44 s). Fig.8 Shear stress, sliding distance, and slip velocity at a typical point on the fault vary with time in Model 2 (a) shows the changes of shear stress with time. The shear stress on the fault begin to increase slowly at 1.5 s, come to the value of ~1.5 MPa at 2.8 s, then falls below the initial value, afterwards gradually increase, the increase rate is accelerated, and go to the peak value at time of 3.43 s (~60 MPa). However, after a while, the shear stress falls below the initial value, but it gradually turn back to the initial state after a short period of time (~1 s). (b) shows the sliding distance varies with time. The sliding distance begins to increase at time of 3.43 s, and it keeps constant at time of 4.44 s. (c) shows the slip-rate changes with time. The slip-rate suddenly increases to peak value (~1.0 m/s) from 0 at 3.43 s, and then it quickly declines in oscillation, and finally stop at time of 4.44 s. |
模型3中,初始应力场为:σ=100 MPa,τ=54 MPa;摩擦本构关系中的参数如下,μs=0.6,μd=0.5,Dc=0.1 m.
在上述条件下,断层首先在成核区开始出现滑移,然后逐步向左右两侧产生自发破裂.图9是断层 两侧的相对滑移距离随时间的变化情况.从图中可以看出,断层上各点在开始破裂后两边的相对滑移距离一直增大,滑移以断层中心呈对称分布.图10给出了断层两侧相对滑移速率随时间的变化,图中显示断层上各点在开始破裂后不久,质点运动速率即降低,但未降至0,亦即破裂后断层未愈合, 这是典型的裂纹型破裂模式.图11显示的是离断层中心右边10 km处的断层上的剪切应力、相对滑移距离、相对滑移速率随时间的变化情况.对照图11a、11b及11c可以看出,断层上剪切应力的变化也是最先出现,尽管有一定的应力增加,但在没有到达临界应力前,断层处在闭锁状态,断面上的滑移为0.在剪切应力达到峰值,超过库仑破裂准则的阈值后,断层开始滑移,此时摩擦系数逐渐减小,当滑移超过临界滑移距离(Dc)时,摩擦系数为动摩擦系数(μd), 与此对应的摩擦力也迅速减小(低于初始值, 见图12a),导致滑移速率快速变小,但未减小至0.此外,由断层的长度及整个破裂过程的时间可以计算得出平均破裂速度为3072 m/s,仍低于S波传播速度,属于亚剪切波速度破裂.
 | 图9 模型3中断层两侧相对滑移距离随时间的变化 x轴表示沿断层距离,y轴表示滑移距离,z轴表示时间;断层上的破裂由中心不断向两边延伸且断层上各点在开始破裂后两边的相对滑移距离逐渐增大. Fig.9 Snapshots of the slip profiles along the interface at various times for Model 3 The x-axis represents the distance along the fault, y-axis denotes the slip, and z-axis stands for time. Rupture on the fault continuously extends out from the center of the fault in both opposite directions, and the relative slip on the fault will gradually increase when the rapture initiates. |
 | 图10 模型3中断层两侧相对滑移速率随时间的变化 x轴表示沿断层距离,y轴表示滑移速率,z轴表示时间;断层上的破裂由中心不断向两边延伸且断层上各点在开始破裂后不久两边的相对滑移速率便降低,但未降低至零. Fig.10 Snapshots of the slip-rate profiles along the interface at various times for Model 3 The x-axis represents the distance along the fault, y-axis denotes the slip-rate, and z-axis stands for time. Rupture on the fault continuously extends out from the center of the fault in both opposite directions, and the relative slip rate on the fault will reduce, but not to zero, when the rapture initiates. |
 | 图11 模型3断层上一典型点的剪切应力、滑移距离、滑移速率随时间的变化 (a)表示 断层上的剪切应力随时间的变化,断层上的剪切应力在t=1.5 s 时开始慢慢增大,在t=2.85 s时上升幅值达~4.5 MPa,然后缓慢下降到初始值以下,再突然增大,在t=3.16 s达到峰值(~60 MPa);但接着很快就下降到初始值以下并维持在50 MPa左右;(b)为滑移距离随时间的变化,在t=3.16 s滑移距离开始增大,后滑移距离不断增加; (c)为滑移速率随时间的变化,在t=3.16 s时滑移突然由0变化到峰值(~4.5 m/s),然后很快振荡下降直到0.6 m/s左右(t=5 s). Fig.11 Shear stress, sliding distance, and slip velocity at a typical point on the fault vary with time in Model 3 (a) shows the changes of shear stress with time. The shear stress on the fault begin to increase slowly at 1.5 s, come to the value of ~4.5 MPa at 2.85 s, then falls below the initial value, afterwards suddenly increase, and go to the peak value at time of 3.16 s (~60 MPa). However, after a while, the shear stress falls below the initial value and remains at 50 MPa. (b) shows the sliding distance varies with time. The sliding distance begins to increase at time of 3.16 s, and it keeps increasing. (c) shows the slip-rate changes with time. The slip-rate suddenly increases to peak value (~4.5 m/s) from 0 at 3.16 s, and then it quickly declines to 0.6 m/s in oscillation at time of 5 s. |
 | 图12 模型4中断层两侧相对滑移距离随时间的变化 x轴表示沿断层距离,y轴表示滑移距离,z轴表示时间;断层上的破裂由中心不断向两边延伸且断层上各点在开始破裂后两边的相对滑移距离逐渐增大. Fig.12 Snapshots of the slip profiles along the interface at various times for Model 4 The x-axis represents the distance along the fault, y-axis denotes the slip, and z-axis stands for time. Rupture on the fault continuously extends out from the center of the fault in both opposite directions, and the relative slip on the fault will gradually increase when the rapture initiates. |
模型4中,初始应力场为:σ=100 MPa,τ=56 MPa;摩擦本构关系中的参数如下,μs=0.6,μd=0.52,Dc=0.1 m.
在上述条件下,断层首先在成核区开始出现滑移,然后逐步向左右两侧产生自发破裂.图12是断层两侧的相对滑移距离随时间的变化情况.从图中可以看出,断层上各点在开始破裂后两边的相对滑移距离一直增大,断层上的最大滑移距离为2.88 m(成核区附近除外);此外,滑移以断层中心呈对称分布.图13给出了断层两侧相对滑移速率随时间的变化,图中显示断层上各点在开始破裂后不久,质点运动速率即降低,但未降至0,亦即破裂后断层未愈合, 这是典型的裂纹型破裂模式.图14显示的是离断层中心右边10 km处的断层上的剪切应力、相对滑移距离、相对滑移速率随时间的变化情况.图14a显示断层上的剪切应力在t=1.5 s时开始慢慢增大,在t=1.8 s达到峰值(~60 MPa);但接着很快就下降到初始值以下并维持在52 MPa左右.图14b中可见在t=1.8 s滑移距离开始增大.图14c中可 见在t=1.8 s时滑移突然由0变化到峰值(~5 m/s), 然后很快振荡下降直到0.7 m/s左右(t=2.3 s);所以该处滑移过程持续的时间与整个破裂的持续时间相当,这是裂纹型破裂.对照图14a、14b及14c可见,在剪切应力达到峰值,超过库仑破裂准则的阈值后,断层开始滑移,经过极短时间,其滑移速率就达到峰值.由于采用的是滑移弱化的摩擦关系,所以一旦断层开始滑动,摩擦系数就减小,滑移超过临界滑移距离(Dc)时,摩擦系数为动摩擦系数(μd), 与此对应的摩擦力也迅速减小(低于初始值, 见图14a),导致滑移速率快速变小.同样,通过计算得出平均破裂速度为5405 m/s,高于S波传播速度,属于超剪切波速度破裂.
 | 图13 模型4中断层两侧相对滑移速率随时间的变化 x轴表示沿断层距离,y轴表示滑移速率,z轴表示时间;断层上的破裂由中心不断向两边延伸且断层上各点在开始破裂后不久两边的相对滑移速率便降低,但未降低至零. Fig.13 Snapshots of the slip-rate profiles along the interface at various times for Model 4 The x-axis represents the distance along the fault, y-axis denotes the slip-rate, and z-axis stands for time. Rupture on the fault continuously extends out from the center of the fault in both opposite directions, and the relative slip rate on the fault will reduce, but not to zero, when the rapture initiates. |
 | 图14 模型4断层上一典型点的剪切应力、滑移距离、滑移速率随时间的变化 (a)表示断层上的剪切应力随时间的变化,断层上的剪切应力在t=1.5 s 时开始慢慢增大,在t=1.8 s达到峰值(~60 MPa);但接着很快就下降到初始值以下并维持在52 MPa左右;(b)为滑移距离随时间的变化,在t=1.8 s滑移距离开始增大,后滑移距离不断增加;(c)为滑移速率随时间的变化,在t=1.8 s时滑移突然由0变化到峰值(~5 m/s),然后很快振荡下降直到0.7 m/s左右(t=2.3 s). Fig.14 Shear stress, sliding distance, and slip velocity at a typical point on the fault vary with time in Model 4 (a) shows the changes of shear stress with time. The shear stress on the fault begin to increase slowly at 1.5 s, go to the peak value at time of 1.8 s (~60 MPa). However, after a while, the shear stress falls below the initial value and remains at 52 MPa. (b) shows the sliding distance varies with time. The sliding distance begins to increase at time of 1.8 s , and it keeps increasing. (c) shows the slip-rate changes with time. The slip-rate suddenly increases to peak value (~5 m/s) from 0 at 1.8 s, and then it quickly declines to 0.7 m/s in oscillation at time of 2.3 s. |
从以上4个不同情况下的4个模型可以看出,模型1和2产生了脉冲型破裂,这是由于改进了摩擦本构关系的结果.若用经典的滑移弱化摩擦关系,不可能产生脉冲型破裂(Lu,2010).
在模拟结果中,可以看出当初始应力场和动摩擦系数不同时,断层的破裂有pulse-like、crack-like、低剪切波速度、超剪切波速度等不同模式.
比较模型1和模型4,可以看出当断层上的初始剪应力增大时,断层的破裂模式将由pulse-like破裂模式转变到crack-like破裂模式,同时断层的破裂速度也将增大.这与在实验室里通过小尺度样本的岩石破裂结果是一致的(Lu, 2010).
比较模型1和模型3及模型2和模型4,可以看出当断层上的静摩擦系数减小时,断层的破裂模式将由pulse-like破裂模式转变到crack-like破裂模式,同时断层的破裂速度也将增大.
同时,从上述模拟结果看,断层自发破裂过程的总体格局与前人结果有类似之处(Shi at el., 2008;Olsen-Kettle et al., 2008),这不仅说明文中的有限元模拟断层破裂过程的方法是有效的,也表明本研究的结果是合理的.
除了上述4种模型外,文中还改变了初始剪切应力大小及摩擦关系中的参数,进行了大量的模拟计算,但始终没有发现产生超剪切-脉冲型破裂模式的情况.是否滑移弱化的摩擦关系就不能产生这种破裂模式,还有待进一步研究.
在滑移弱化摩擦关系中特征滑移距离Dc是一个很重要的量,它的物理意义是摩擦系数从静摩擦系数演化到动摩擦系数时,断层两边的相对滑移距离.通过对Dc取不同值模拟研究发现:Dc取值越大,断层的自发破裂速度会越小.当Dc取值过大时,断层的自发破裂会在成核区附近停止.为了使模拟结果更符合实际断层的破裂速度,在上述所有模型中,Dc取值均为0.1 m.
上述模型中运用的是改进的滑移弱化摩擦关系,但在模拟断层破裂过程中,前人尝试多种类型的摩擦关系,如:速率相关、时间相关、温度相关等.其中速率弱化摩擦关系的表达式(朱守彪和张培震,2009;Zhu & Zhang, 2010, 2013)如下:

式中μ为摩擦系数,当V=Vref时,μ=μ0,V是滑移 速率,Vref是参考速率.参数a和b与材料的属性相关.
下面就利用这种速率弱化的摩擦关系来模拟断层破裂过程,根据参数a、b的不同,有两种不同情形的模拟结果(分别称为模型5和模型6).
模型5中,初始应力场为:σ=100 MPa,τ=56 MPa;摩擦本构关系中的参数如下,μ0=0.6,a=0.01,b=0.025.
在上述条件下,断层也是首先在成核区开始出现滑移,然后逐步向左右两侧产生自发破裂.图15是断层两侧的相对滑移距离随时间的变化情况.从图中可以看出,断层上各点在开始破裂后不久两边的相对滑移距离便保持不变,滑移以断层中心呈对称分布.图16给出了断层两侧相对滑移速率随时间的变化,图中显示断层上各点在开始破裂后不久,质点运动速率即降低至0,亦即破裂后断层很快就愈合, 这是典型的脉冲型破裂.
 | 图15 模型5中沿断层各点相对滑移距离随时间的变化 x轴表示沿断层距离,y轴表示滑移距离,z轴表示时间;断层上的破裂由中心不断向两边延伸且断层上各点在开始破裂后不久两边的相对滑移距离便保持不变. Fig.15 Snapshots of the slip profiles along the interface at various times for Model 5 The x-axis represents the distance along the fault, y-axis denotes the slip, and z-axis stands for time. Rupture on the fault continuously extends out from the center of the fault in both opposite directions, and the relative slip on the fault will remain unchanged shortly after the rapture initiates. |
 | 图16 模型5中沿断层各点相对滑移速率随时间的变化 x轴表示沿断层距离,y轴表示滑移速率,z轴表示时间;断层上的破裂由中心不断向两边延伸且断层上各点在开始破裂后不久两边的相对滑移速率便降低至零. Fig.16 Snapshots of the slip-rate profiles along the interface at various times for Model 5 The x-axis represents the distance along the fault, y-axis denotes the slip-rate, and z-axis stands for time. Rupture on the fault continuously extends out from the center of the fault in both opposite directions, and the relative slip rate on the fault will reduce to zero shortly after the rapture initiates. |
在模型6中,初始应力场为:σ=100 MPa,τ= 56 MPa;摩擦本构关系中的参数如下,μ0=0.6,a=0.01,b=0.06.
图17显示了在这种模型下,断层两侧的相对滑移距离随时间的变化情况.从图中可以看出,断层上各点在开始破裂后两边的相对滑移距离一直增大,滑移以断层中心呈对称分布.图18给出了断层两侧相对滑移速率随时间的变化,图中显示断层上各点在开始破裂后不久,质点运动速率即降低,但未降至0,亦即破裂后断层未愈合,这是裂纹型破裂模式.
| 图17 模型6中沿断层各点相对滑移距离随时间的变化 x轴表示沿断层距离,y轴表示滑移距离,z轴表示时间;断层上的破裂由中心不断向两边延伸且断层上各点在开始破裂后两边的相对滑移距离逐渐增大. Fig.17 Snapshots of the slip profiles along the interface at various times for Model 6 The x-axis represents the distance along the fault, y-axis denotes the slip, and z-axis stands for time. Rupture on the fault continuously extends out from the center of the fault in both opposite directions, and the relative slip on the fault will gradually increase when the rapture initiates. |
| 图18 模型6中沿断层各点相对滑移速率随时间的变化 x轴表示沿断层距离,y轴表示滑移速率,z轴表示时间;断层上的破裂由中心不断向两边延伸且断层上各点在开始破裂后不久两边的相对滑移速率便降低,但未降低至零. Fig.18 Snapshots of the slip-rate profiles along the interface at various times for Model 6 The x-axis represents the distance along the fault, y-axis denotes the slip-rate, and z-axis stands for time. Rupture on the fault continuously extends out from the center of the fault in both opposite directions, and the relative slip rate on the fault will reduce, but not to zero, when the rapture initiates. |
比较上述两种模型,可以看出,在初始场不变的情形下,若b-a值较小,容易产生脉冲型破裂,但当b-a值较大时,会产生裂纹型破裂.
本文是将实际地震断层进行高度简化,假定材 料均匀且为线弹性情况下的模拟结果.实际断层为三维结构,并且有很多弯曲、分支、阶跃等复杂的几何.如何考虑这种实际的断层几何来进行三维模拟,有限元处理中还需进行大量深入的探索.此外,三维模型比二维情况需要更多的计算资源(计算速度、数据存贮、传输等),如何解决也需继续研究.另外,摩擦关系的选择,也是今后研究的重要方面.
文中研究的另一不足是,人为给定初始应力场以及进行人工干预才能发动地震(如:人为给定成核区及成核过程).为了尝试解决这些问题,朱守彪等(2008,2013)将有限单元方法进行了改进,使之能够在静态与动态之间自动转换.改进后的有限元模型既能计算长期缓慢的地震孕育过程(百年尺度或更长),又能对地震发生的同震过程进行模拟.在模拟地震破裂过程中,无需进行任何人工干预(如减小摩擦系数、改变应力状态等),这样利用改进后的有限元方法,将研究地震破裂过程与地震孕育过程综合考虑,克服了人为给定初始应力场的限制(按照实际地质过程,由构造加载获得).以后将尝试利用这种更加符合实际地震发生过程的加载方式来研究断层自发破裂的动力学过程.
根据上述分析及本文的模拟结果,得出以下初步结论:
文中对滑移弱化摩擦关系进行了改进,从模拟结果来看改进是有效的.同时,文中摩擦的破裂形态与前人结果有相似之处,说明本文利用有限单元方法对断层破裂过程进行的动态数值模拟是合理的,其方法是可行的.
模拟结果表明,采用改进的滑移弱化摩擦关系能够产生脉冲型破裂模式,而经典的滑移弱化摩擦关系不能产生脉冲型破裂模式.模拟结果还显示,初始应力场对断层的自发破裂动力过程产生重要影响,当初始应力场中剪应力水平较低时,容易产生脉冲型(pulse-like)破裂,当初始剪应力较高时,会产生裂纹型(crack-like)破裂;这与在实验室里通过小尺度样本的岩石破裂结果是一致的.此外,模拟结果还表明,滑移弱化摩擦关系中的动摩擦系数对断层破裂过程也有重要作用,当动摩擦系数较大时,断层的破裂动力过程易于产生脉冲型破裂,而当动摩擦系数较小时,将更倾向于产生裂纹型破裂.最后,本文也采用速率弱化摩擦关系对断层自发破裂过程进行了模拟,结果表明,在初始场及其他条件不变时,若摩擦关系中b-a值较小,容易产生脉冲型破裂;但当b-a值较大时,会产生裂纹型破裂.
致 谢 十分感谢两位匿名审稿专家所提出的问题以及对文章修改所给予的建设性意见.| [1] | Aagaard B T, Heaton T H, Hall J F. 2001. Dynamic earthquake ruptures in the presence of lithostatic normal stresses: Implications for friction models and heat production. Bulletin of the Seismological Society of America, 91(6): 1765-1796. |
| [2] | Andrews D J. 1973. A numerical study of tectonic stress release by underground explosions. Bulletin of the Seismological Society of America, 63(4): 1375-1391. |
| [3] | Andrews D J. 1976a. Rupture velocity of plane strain shear cracks. Journal of Geophysical Research, 81(32): 5679-5687. |
| [4] | Andrews D J. 1976b. Rupture propagation with finite stress in antiplane strain. Journal of Geophysical Research, 81(20): 3575-3582. |
| [5] | Andrews D J. 1985. Dynamic plane-strain shear rupture with a slip-weakening friction law calculated by a boundary integral method. Bulletin of the Seismological Society of America, 75(1): 1-21. |
| [6] | Andrews D J. 1999. Test of two methods for faulting in finite-difference calculations. Bulletin of the Seismological Society of America, 89(4): 931-937. |
| [7] | Aochi H, Fukuyama E, Matsu′ura M. 2000. Spontaneous rupture propagation on a non-planar fault in 3-D elastic medium. Pure and Applied Geophysics, 157(11-12): 2003-2027. |
| [8] | Aochi H, Kato A. 2010. Dynamic rupture of crosscutting faults: A possible rupture process for the 2007 Mw6.6 Niigata-ken Chuetsu-Oki earthquake. Journal of Geophysical Research: Solid Earth (1978-2012), 115(B5), doi: 10.1029/2009JB006556. |
| [9] | Ben-Zion Y. 2001. Dynamic ruptures in recent models of earthquake faults. Journal of the Mechanics and Physics of Solids, 49(9): 2209-2244. |
| [10] | Bizzarri A. 2011. On the deterministic description of earthquakes. Reviews of Geophysics, 49(3): RG3002. doi: 10.1029/2011RG000356. |
| [11] | Bizzarri A. 2012.Rupture speed and slip velocity: What can we learn from simulated earthquakes? Earth and Planetary Science Letters, 317: 196-203. |
| [12] | Brace W F, Byerlee J D. 1966. Stick-slip as a mechanism for earthquakes. Science, 153(3739): 990-992. |
| [13] | Cai Y E, He T, Wang R. 2000. Numerical simulation of dynamic process of the Tangshan earthquake by a new method-LDDA. Pure and Applied Geophysics, 157(11-12): 2083-2104. |
| [14] | Cai Y E, He T, Wang R. 1999. Numerical simulation of dynamic process of the Tangshan earthquake. Acta Seismologica Sinica, 12(5): 516-524. |
| [15] | Chen Z A, Bai W M, Lin B H, et al. 2003. Numerical simulation for rupture processes of a series of strong earthquakes (Ms>7) in North China since 1966. Chinese J. Geophys.(in Chinese), 46(3): 373-381. |
| [16] | Chen X F, Zhang H M. 2006. Modelling rupture dynamics of a planar fault in 3-D half space by boundary integral equation method: An overview. nbsp; Pure and Applied Geophysics, 163(2-3): 267-299.& |
| [17] | Clayton R, Engquist B. 1977. Absorbing boundary conditions for acoustic and elastic wave equations. Bulletin of the Seismological Society of America, 67(6): 1529-1540. |
| [18] | Cochard A, Madariaga R. 1994. Dynamic faulting under rate-dependent friction. Pure and Applied Geophysics, 142(3-4): 419-445. |
| [19] | Dalguer L A, Day S M. 2007. Staggered-grid split-node method for spontaneous rupture simulation. Journal of Geophysical Research: Solid Earth (1978-2012), 112(B2), doi: 10.1029/2006JB004467. |
| [20] | Das S. 1980. A numerical method for determination of source time functions for general three-dimensional rupture propagation. Geophysical Journal International, 62(3): 591-604. |
| [21] | Day S M. 1982. Three-dimensional finite difference simulation of fault dynamics: rectangular faults with fixed rupture velocity. Bulletin of the Seismological Society of America, 72(3): 705-727. |
| [22] | Dieterich J H. 1978. Time-dependent friction and the mechanics of stick-slip. Pure and Applied Geophysics, 116(4-5): 790-806. |
| [23] | Dieterich J H. 1979. Modeling of rock friction: 1. Experimental results and constitutive equations. Journal of Geophysical Research: Solid Earth, 84(B5): 2161-2168. |
| [24] | Dieterich J H. 1994. A constitutive law for rate of earthquake production and its application to earthquake clustering. Journal of Geophysical Research: Solid Earth (1978-2012), 99(B2): 2601-2618. |
| [25] | Duan B, Oglesby D D. 2005. Multicycle dynamics of nonplanar strike-slip faults. Journal of Geophysical Research: Solid Earth (1978-2012), 110(B3), doi: 10.1029/2004JB003298. |
| [26] | Duan B. 2010. Role of initial stress rotations in rupture dynamics and ground motion: A case study with implications for the Wenchuan earthquake. Journal of Geophysical Research: Solid Earth (1978-2012), 115(B5), doi: 10.1029/2009JB006750. |
| [27] | Duan B. 2012. Dynamic rupture of the 2011 Mw 9.0 Tohoku-Oki earthquake: Roles of a possible subducting seamount. Journal of Geophysical Research: Solid Earth (1978-2012), 117 (B5), doi: 10.1029/2011JB009124. |
| [28] | Ely G P, Day S M, Minster J B. 2009. A support-operator method for 3-D rupture dynamics. Geophysical Journal International, 177(3): 1140-1150. |
| [29] | Heaton T H. 1990. Evidence for and implications of self-healing pulses of slip in earthquake rupture. Physics of the Earth and Planetary Interiors, 64(1): 1-20. |
| [30] | Hibbitt H, Karlsson B, Sorensen P. 2012. ABAQUS theory manual, version 6.12. Pawtucket, Rhode Island, USA. |
| [31] | Hillers G, Ben-Zion Y, Mai P. 2006. Seismicity on a fault controlled by rate-and state-dependent friction with spatial variations of the critical slip distance. Journal of Geophysical Research, 111(B1): B01403, doi: 10.1029/2005JB003859. |
| [32] | Ide S, Baltay A, Beroza G C. 2011. Shallow dynamic overshoot and energetic deep rupture in the 2011 Mw9.0 Tohoku-Oki earthquake. Science, 332(6036): 1426-1429. |
| [33] | Ida Y. 1972. Cohesive force across the tip of a longitudinal-shear crack and Griffith's specific surface energy. Journal of Geophysical Research, 77(20): 3796-3805. |
| [34] | Johnson T. 1981. Time-dependent friction of granite: implications for precursory slip on faults. Journal of Geophysical Research, 86(B7): 6017-6028, doi: 10.1029/JB086iB07p06017. |
| [35] | Kanamori H, Anderson D L. 1975. Theoretical basis of some empirical relations in seismology. Bulletin of the Seismological Society of America, 65(5): 1073-1095. |
| [36] | Kostrov B. 1966. Unsteady propagation of longitudinal shear cracks. Journal of Applied Mathematics and Mechanics, 30(6): 1241-1248. |
| [37] | Lapusta N, Rice J R, Ben-Zion Y, et al. 2000. Elastodynamic analysis for slow tectonic loading with spontaneous rupture episodes on faults with rate-and state-dependent friction. Journal of Geophysical Research, 105(B10): 23765-23,789. |
| [38] | Lapusta N. 2001. Elastodynamic analyses of sliding with rate and state friction [Ph. D. thesis]. Cambridge: Harvard University. |
| [39] | Lozos J C, Oglesby D D, Brune J N, et al. 2012. Small intermediate fault segments can either aid or hinder rupture propagation at stepovers. Geophysical Research Letters, 39(18), L18305, doi:10:1029/2012GL053005. |
| [40] | Madariaga R, Olsen K, Archuleta R. 1998. Modeling dynamic rupture in a 3D earthquake fault model. Bulletin of the Seismological Society of America, 88(5): 1182-1197. |
| [41] | Lu X, Lapusta N, Rosakis A J. 2010. Pulse-like and crack-like dynamic shear ruptures on frictional interfaces: experimental evidence, numerical modeling, and implications. International Journal of Fracture, 163(1-2): 27-39. |
| [42] | Lu X, Rosakis A J, Lapusta N. 2010. Rupture modes in laboratory earthquakes: Effect of fault prestress and nucleation conditions. Journal of Geophysical Research: Solid Earth (1978-2012), 115(B12), doi: 10.1029/2009JB006833. |
| [43] | Madariaga R. 1976. Dynamics of an expanding circular fault. Bulletin of the Seismological Society of America, 66(3): 639-666. |
| [44] | Marone C. 1998. Laboratory-derived friction laws and their application to seismic faulting. Annual Review of Earth and Planetary Sciences, 26(1): 643-696. |
| [45] | McCloskey J, Nalbant S S, Steacy S. 2005. Indonesian earthquake: Earthquake risk from co-seismic stress. Nature, 434(7031): 291-291. |
| [46] | Oglesby D D, Archuleta R J, Nielsen S B. 1998. Earthquakes on dipping faults: the effects of broken symmetry. Science, 280(5366): 1055-1059. |
| [47] | Oglesby D D, Archuleta R J, Nielsen S B. 2000. The three-dimensional dynamics of dipping faults. Bulletin of the Seismological Society of America, 90(3): 616-628. |
| [48] | Oglesby D D, Mai P M, Atakan K, et al. 2008. Dynamic models of earthquakes on the North Anatolian fault zone under the Sea of Marmara: Effect of hypocenter location. Geophysical Research Letters, 35(18), doi: 10.1029/2008GL035037. |
| [49] | Ohnaka M, Yamashita T. 1989. A cohesive zone model for dynamic shear faulting based on experimentally inferred constitutive relation and strong motion source parameters. Journal of Geophysical Research: Solid Earth (1978-2012), 94(B4): 4089-4104. |
| [50] | Ohnaka M. 1993. Critical size of the nucleation zone of earthquake rupture inferred from immediate foreshock activity. Journal of Physics of the Earth, 41(1): 45-56. |
| [51] | Ohnaka M. 1996. Nonuniformity of the constitutive law parameters for shear rupture and quasistatic nucleation to dynamic rupture: a physical model of earthquake generation processes. Proceedings of the National Academy of Sciences, 93(9): 3795-3802. |
| [52] | Ohnaka M, Shen L F. 1999. Scaling of the shear rupture process from nucleation to dynamic propagation: Implications of geometric irregularity of the rupturing surfaces. Journal of Geophysical Research: Solid Earth (1978-2012), 104 (B1): 817-844. |
| [53] | Olsen-Kettle L, Weatherley D, Saez E, et al. 2008. Analysis of slip-weakening frictional laws with static restrengthening and their implications on the scaling, asymmetry, and mode of dynamic rupture on homogeneous and bimaterial interfaces. Journal of Geophysical Research: Solid Earth (1978-2012), 113(B8), doi. 10.1029/2007JB005454. |
| [54] | Palmer A C, Rice J. 1973. The growth of slip surfaces in the progressive failure of over-consolidated clay. Proceedings of the Royal Society of London. A. Mathematical and Physical Sciences, 332(1591): 527-548. |
| [55] | Pelties C, de la Puente J, Ampuero J P, et al. 2012. Three-dimensional dynamic rupture simulation with a high-order discontinuous Galerkin method on unstructured tetrahedral meshes. Journal of Geophysical Research: Solid Earth (1978-2012), 117(B2), doi: 10.1029/2011JB008857. |
| [56] | Rice J R, Ben-Zion Y. 1996. Slip complexity in earthquake fault models. Proceedings of the National Academy of Sciences, 93(9): 3811-3818. |
| [57] | Ruina A. 1983. Slip instability and state variable friction laws. Journal of Geophysical Research, 88(B12): 10359-10370. |
| [58] | Scholz C H. 1998. Earthquakes and friction laws. Nature, 391(6662): 37-42. |
| [59] | Scholz C H. 2002. The Mechanics of Earthquakes and Faulting. Cambridge: Cambridge University Press. |
| [60] | Shi Z, Ben-Zion Y, Needleman A. 2008. Properties of dynamic rupture and energy partition in a solid with a frictional interface. Journal of the Mechanics and Physics of Solids, 56(1): 5-24. |
| [61] | Somerville P, Irikura K, Graves R, et al. 1999. Characterizing crustal earthquake slip models for the prediction of strong ground motion. Seismological Research Letters, 70(1): 59-80. |
| [62] | Templeton E L, Rice J R. 2008. Off-fault plasticity and earthquake rupture dynamics: 1. Dry materials or neglect of fluid pressure changes. Journal of Geophysical Research, 113(B9): B09306, doi: 10.1029/2007JB005529. |
| [63] | Templeton E L, Bhat H S, Dmowska R, et al. 2010. Dynamic rupture through a branched fault configuration at Yucca Mountain, and resulting ground motions. Bulletin of the Seismological Society of America, 100(4): 1485-1497. |
| [64] | Tse S T, Rice J R. 1986. Crustal earthquake instability in relation to the depth variation of frictional slip properties. Journal of Geophysical Research: Solid Earth (1978-2012), 91(B9): 9452-9472. |
| [65] | Tullis T E. 1996. Rock friction and its implications for earthquake prediction examined via models of Parkfield earthquakes. Proceedings of the National Academy of Sciences, 93(9): 3803-3810. |
| [66] | Viesca R C, Templeton E L, Rice J R. 2008. Off-fault plasticity and earthquake rupture dynamics: 2. Effects of fluid saturation. Journal of Geophysical Research: Solid Earth (1978-2012), 113(B9), doi. 10.1029/2007JB005530. |
| [67] | Wang X C. 2003. Finite Element Method (in Chinese). Beijing: Tsinghua University Press. |
| [68] | Zhang H, Chen X. 2006. Dynamic rupture on a planar fault in three-dimensional half space-I. Theory. Geophysical Journal International, 164(3): 633-652. |
| [69] | Zhang W B, Iwata T, Irikura K. 2010. Dynamic simulation of the 1999 Chi-Chi, Taiwan, earthquake. Journal of Geophysical Research: Solid Earth (1978-2012), 115(B4), doi: 10.1029/2008JB006201. |
| [70] | Zhu S B, Xing H L, Xie F R, et al. 2008. Simulation of earthquake processes by finite element method: The case of megathrust earthquakes on the Sumatra subduction zone. Chinese J. Geophys. (in Chinese), 51(2): 460-468. |
| [71] | Zhu S B, Zhang P Z. 2013. FEM simulation of interseismic and coseismic deformation associated with the 2008 Wenchuan Earthquake. Tectonophysics, 584: 64-80. |
| [72] | Zhu S B, Zhang P Z. 2010. Numeric modeling of the strain accumulation and release of the 2008 Wenchuan, Sichuan, China, earthquake. Bulletin of the Seismological Society of America, 100(5B): 2825-2839. |
| [73] | Zhu S B, Zhang P Z. 2009. A study on the dynamical mechanisms of the Wenchuan Ms8.0 earthquake, 2008. Chinese J.Geophys.(in Chinese), 52(2): 418-427. |
| [74] | Zienkiewicz O C, Taylor R L, Zhu J Z. 2005. The Finite Element Method: Its Basis and Fundamentals: Its Basis and Fundamentals. London: Butterworth-Heinemann. |
| [75] | 蔡永恩, 何涛, 王仁. 1999. 1976年唐山地震震源动力过程的数值模拟. 地震学报, 21(5): 469-477. |
| [76] | 陈祖安, 白武明, 林邦慧等. 2003. 1966年以来华北地区一系列七级大震破裂过程的数值模拟. 地球物理学报, 46(3): 373-381. |
| [77] | 王勖成. 2003. 有限单元法. 北京: 清华大学出版社. |
| [78] | 朱守彪, 邢会林, 谢富仁等. 2008. 地震发生过程的有限单元法模拟--以苏门答腊俯冲带上的大地震为例. 地球物理学报, 51(2): 460-468. |
| [79] | 朱守彪, 张培震. 2009. 2008年汶川Ms8.0 地震发生过程的动力学机制研究. 地球物理学报, 52(2): 418-427. |