 2014, Vol. 57


岩石圈一词出现于19世纪末至20世纪初,指的是地球最外部的固体、不变形的圈层. 随后,软流圈一词也相伴而生,指的是岩石圈下部流体、可变形的圈层. 在实际应用中不同学科确定岩石圈底界的方法不同,也就产生了所谓力学岩石圈、热岩石圈、地震岩石圈、弹性岩石圈、岩石学岩石圈和电性岩石圈等. 正是由于不同定义的存在,使得岩石圈变成了一个极其混乱的概念(Anderson, 1995).
在众多定义的岩石圈中,热岩石圈与地震岩石圈常常用来互相对比. 热岩石圈的定义是地球最外面的热传导层(Morgan, 1984). 地震岩石圈指的是 位于低速软流圈之上的高速盖层(Anderson, 1995). 就全球范围而言,二者在某些地区吻合得较好,而在某些地区差异较大.二者的差异反映了地球上地幔 结构本身的特点,其中蕴含着丰富的地球动力学信息.
地幔对流数值研究结果指出,固体岩石圈与流体地幔之间并不是一个明显的界面,而存在一边界层(Jaupart and Mareschal, 1999), 也称为流变边界层(Sleep, 2003; 2006). 相对于固体岩石圈的纯传导与流体软流圈的纯对流,在流变边界层内热传递的方式是传导与对流共存. 流变边界层的存在是造成岩石圈底界差异的重要原因.
本文旨在数值模拟、讨论软流圈黏性系数、固体岩石圈厚度、岩石圈热状态等因素对地幔对流、上地幔热结构及流变边界层的影响.对华北克拉通热岩石圈与地震岩石圈厚度进行对比、讨论,揭示其差异的地球动力学机制.
本文建立二维热传导/对流数值模型,模型长2600 km,宽650 km (Petitjean et al., 2006). 模型 包括固体岩石圈(地壳与固体地幔)和流体地幔(图1).这里将流体地幔看作不可压缩的牛顿流体并作Boussinesq近似,热对流遵循以下质量、动量和能量守恒方程:
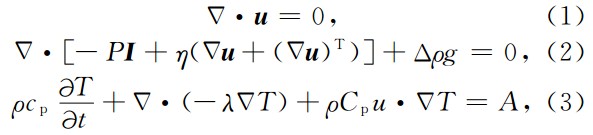
其中,u,P和T是分别速度、压力和温度.I代表单位对角矩阵.t是时间,η是地幔黏性系数,g是重力加速度.Cp,λ和A分别是比热、热导率和生热率. Δρ为密度异常,Δρ=ρ0αΔT,式中α是热膨胀系数.
 | 图1 理论模型 Fig.1 Model setup |
固体岩石圈不参与地幔对流,其中u为0,其热传递方式为纯粹的热传导. 本文基于Comsol Multiphysics商业软件(http://www.comsol.com/) 进行二维有限元数值模拟计算. 这里分别建立边界加热与内部加热两组模型.
模型1:模型上、下边界均采用温度边界(Doin et al., 1997; Cooper et al., 2004),分别为0 ℃和1500 ℃. 两个侧边界为绝热边界. 流体软流圈的下边界为滑移边界,其余三个边界为无滑移边界. 固体岩石圈厚190 km,地壳厚度40 km,软流圈黏性系数1×10²¹Pa·s. 其余模型参数见表1.
|
|
表1 模型参数 Table 1 Model parameters |
模型2:模型上边界为温度边界 (0 ℃),下边界为热流边界 (0 mW/m2). 给定软流圈(流体地幔)一常数生热率,而固体地幔生热率为0,使得地幔所产生的地幔热流(Qm)为15 mW/m2. 其余边界条件及模型参数如模型1.
在以上两组模型中瑞利数Ra分别为
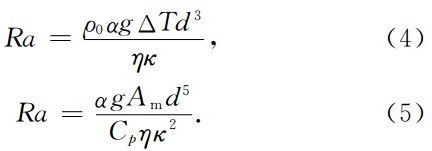
其中d是软流圈的厚度,κ为热扩散系数,其他参数含义如同公式(1—3). 根据表1中的参数值可得到Ra的数值分别为1.8×10⁵和2.8×10⁵,远大于触 发对流的最小临界值(Turcotte and Schubert, 2002), 这种情况下,流体地幔发生对流.
自1935年以来软流圈黏性系数一直被认为是1021Pa·s(Mitrovica, 1996). 近年来的研究对于软流圈的粘度结构有了很大的改进. Milne等(2001)基于空间-大地测量结果(如全球定位系统)指出,软流圈黏性系数为(5-10)×1020 Pa·s. Mitrovica and Forte(2004)利用对流及冰期均衡调整数据反 演出软流圈黏性系数为4×10²⁰ Pa·s. 基于GRACE 和相对海平面数据,Paulson(2007)得出的结果为5.3×10²⁰ Pa·s. 与此同时,越来越多的研究指出上地幔黏性系数存在横向不均匀性. Doin等(1997)的模拟结果显示,位于海洋岩石圈下部的软流圈黏性系数约7×10¹⁸ Pa·s,要小于大陆岩石圈下的软流圈黏性系数. Dixon等(2004)研究表明美国西部活动构造区的软流圈黏性系数为~1018×1019Pa·s.
为了讨论软流圈黏性系数对流变边界层的影响,模拟中假定固体岩石圈厚度保持190 km不变. 首先取软流圈黏性系数为1×10²¹Pa·s,给定一随机温度场作为初始温度场,热膨胀引起的密度差产生浮力,从而导致地幔对流. 经过几Ga即可得到稳态温度场和流场分布(图2).
 | 图2 Model 1与Model 2模拟结果对比 (a)和(c)为温度场,其中箭头表示的是流场的方向. (b)和(d)为温度梯度. Fig.2 Comparison of modeling results between Model 1 and Model 2 (a) and (c) illustrate the temperature fields. The arrows indicate the flow directions.(b) and (d) represent the fields of temperature gradient. |
由于地幔对流驱动机制的主控因素是温度差异所造成的密度差异而产生的浮力,在地幔内部形成局部对流环. 在模型1和2两种加热模式下,地幔对流特征均表现为上升流上宽下窄,而下降流反之. 不同的只是,模型1中上升流与下降流速度相当,地幔对流速度最高达0.9 cm/a;而模型2中,上升流 很宽但很慢 (约0.2 cm/a),地幔下降流窄而快(约0.7 cm/a). 总之,上升流对岩石圈底界附近温度梯度的影响占主导地位,即流变边界层区域地温梯度场(图2b, d)受上升流控制. 下降流对流变边界层地温梯度场的影响则是局部的,局限在很窄的范围. 故文中列举出的都是地幔上升流中心处的计算结果.
基于模拟所得到的上地幔地温及地温梯度曲线 (图3),上地幔可分为三层. 最上层为固体岩石圈,其中热传递方式为纯传导,也称为传导边界层(Jaupart and Mareschal, 1999). 也有人称该层为停滞层或化学层(Sleep, 2003; 2006; Lee et al., 2005). 地温梯度由地表向深部衰减,在Moho面地温梯度降至4~5 K/km,并在固体地幔中保持该值不变. 在固体岩石圈下方存在一很厚的温度过渡带 (1200~1500 ℃),地温梯度从热边界层顶部逐渐降低接近0,一般称它作流变边界层(Sleep, 2003; 2006).在该层内热传导与热对流共存. 最下面一层为对流地幔层,地温梯度很小.
 | 图3 Model 1(a)和Model 2(b)预测的地温曲线与地温梯度曲线(RBL:流变边界层) Fig.3 Profiles of geotherm and temperature gradient for Model 1 (a) and Model 2 (b) (RBL:Rheological boundary layer) |
模拟结果显示流变边界层随着软流圈黏性系数 的降低而减薄. 在黏性系数为1×10²¹Pa·s时,两 组模型中流变边界层厚度分别为约90 km和约130 km (图3). 随着软流圈黏性系数逐渐降低至1× 10¹⁹ Pa·s,流变边界层厚度均随之降低 (图4a—b), 流变边界层的厚度与lg(η)成正比 (图4c—d).
 | 图4 软流圈黏性系数对流变边界层的影响.由于流变边界层区域地温梯度场主要受上升流控制,便于对比所选剖面均处于地幔上升流中心的位置. Fig.4 Influences of asthenospheric viscosity on the RBL. Since the regional temperature gradient field of the RBL is influenced mainly by upwell, the profiles selected locate on the upwell center of mantle flow |
本节的模拟保持地幔黏性系数为1×10²¹Pa·s, 首先逐步改变固体岩石圈厚度 (80~190 km). 对于Model 2,在此过程中地幔生热率(Am)逐渐减少以保证放射性生热产生地幔热流保持15 mW/m2不变. 其他参数保持不变,来观察固体岩石圈厚度对流变边界层的影响.
 | 图5 固体岩石圈厚度对流变边界层的影响 Fig.5 Influence of solid lithospheric thickness on the RBL |
Model 1的模拟结果显示(图4a),随着固体岩石圈底界的上移,流变边界层底界也随之同步上移,二者的间距始终保持不变. 在这种边界条件下,流变边界层的厚度并不受固体岩石圈厚度的影响.
Model 2的模拟结果(图4b)与Model 1的结果类似. 流变边界层底界随着固体岩石圈底界的上移而上移,但二者的间距略有减少. 在内部加热模式下,随着固体岩石圈厚度由190 km减薄至80 km,流变边界层的厚度从130 km减至110 km.
总之,两组模型所揭示的上地幔热结构表明,流变边界层的厚度基本上不受或固体岩石圈厚度的影响很小.
上组模型只改变了固体岩石圈的厚度,并没有改变地壳厚度及其生热率. 在下面一组模拟中,固体岩石圈厚与地壳分别取80 km和30 km,地幔黏性系数1×10²¹Pa·s,通过改变地壳生热率来观测岩石圈热结构对流变边界层的影响.
地壳生热率分别取0.65 μW/m3、1 μW/m3和1.3 μW/m3. 两组模拟结果显示(图6),地壳生热率的增加会导致地壳的温度及地温梯度的增加,从而改变整个岩石圈热结构分布,但仍无法改变流变边界层的厚度. 因此,流变边界层对岩石圈本身的结构特征并不敏感,而主要受软流圈黏性系数控制.
 | 图6 地壳生热率对上地幔热结构的影响 图中实线为地温梯度、虚线为温度. 黑色、蓝色和红色曲线分别代表地壳生热率分别取0.65 μW/m3、1 μW/m3和1.3 μW/m3的结果. Fig.6 Influences of crustal heat production on the thermal structure of the upper mantle The solid lines represent the temperature gradient, and the dash lines indicate the geotherms. Black, blue and red lines show the results when crustal heat production is 0.65 μW/m3、1 μW/m3和1.3 μW/m3, respectively. |
尽管热岩石圈的概念是指位于对流软流圈之上的热传导层,但在实际计算中却存在多种方法. 由于热传导层与热对流层之间流变边界层的存在,其间热传导与热对流共存,温度介于1200~1500 ℃之间,使得热岩石圈底界的确定方法分为三种. 第一种:把某一绝热等温线当作岩石圈的底边界温度,如1200 ℃(Petitjean et al., 2006)、1250 ℃(Lewis et al., 2003)、1280 ℃(McKenzie and Bickle, 1988)、1300 ℃(Jaupart and Mareschal, 1999; Artemieva and Mooney, 2001). 第二种:将热传导地温线与玄武岩固相线相交的深度定义为岩石圈底界面(Pollack and Chapman, 1977;Lachenbruch, 1978;Chapman and Furlong, 1992);该定义多用于海洋岩石圈 (施小斌等,2000)及裂谷盆地岩石圈底界的确定,并不适用于冷而厚的克拉通岩石圈. 第三种:将热传导地温线与地幔绝热曲线相交的深度定义为岩石圈底界面(臧绍先等, 2002;刘绍文等, 2005). 尽管方法不同,但总的来讲,热岩石圈底界更为接近流变边界层的上界.
由于温度的连续变化全球地球物理技术,如地震层析成像, 只能确定传导层与流变边界层总和之下的部分,即流变边界层的下界(Jaupart and Mareschal, 1999; Artemieva, 2009).也就是说,地震岩石圈厚度一般要大于热岩石圈厚度. 从全球典型克拉通热岩石圈与地震岩石圈厚度的对比 (表2) 也可以清楚地反映这一特征.
|
|
表2 克拉通热岩石圈与地震岩石圈厚度对比 Table 2 Comparison between the thermal and seismic lithospheric thicknesses |
华北克拉通的地震结果显示,岩石圈厚度自西部鄂尔多斯的220 km向东逐渐减薄,至于渤海湾盆地岩石圈厚度约80 km(Chen, 2010),该结果被 视为华北克拉通破坏的重要证据(Zhu et al., 2011;2012). 热岩石圈也同样显示出西厚、东薄的特征 (图7).在华北克拉通西部,以地温线与地幔绝热曲 线交点定义的岩石圈底界面约为125 km(焦亚先等,2013)拟或140~157 km (刘绍文等, 2008), 以 1350 ℃等温面深度计算的鄂尔多斯热岩石圈约130~140 km (汪洋和程素华, 2011),与地震岩石圈相差80~90 km,与国际上其他克拉通的情况类似. 二者之间差异在汾渭地堑有所减小,热岩石圈与地震岩石圈厚度分别约为76 km(汪洋等,2001)、约140 km(Chen,2010). 然而在华北克拉通东部的 渤海湾盆 地,热岩石圈厚度为70~80 km (何丽娟等,2001; 汪洋等,2001;刘绍文等, 2005),与地震岩石圈厚度相当接近.
 | 图7 华北克拉通热岩石圈与地震岩石圈底界对比(地震结果来自文献(Chen, 2010)) Fig.7 Comparison between the thermal and seismic lithospheric bases for NCC (The seismic results from Chen (2010)) |
热岩石圈与地震岩石圈底界自西向东的接近,暗示着流变边界层厚度自西向东的减薄,也就意味着华北克拉通岩石圈下部的软流圈地幔黏性系数自西向东逐渐降低. 这一特征从一侧面印证了太平洋俯冲脱水作用对华北克拉通的影响. 太平洋板块在中生代向欧亚板块下的快速俯冲,并停滞在660 km的地幔转换带,形成宽约1000 km的大地幔楔(Lei and Zhao, 2005; Zhao et al., 2007). 俯冲下去的太平洋板片通过脱水作用在不同深度源源不断地释放出富水流体,从而导致大地幔楔内地幔对流变得更加活跃(Inoue, 1994;Komabayashi et al., 2004;Ohtani et al., 2004;Lei and Zhao, 2005; Zhao et al., 2007; Zhao et al., 2009). 这种快速俯冲太平洋板块的深部脱水作用同样在Yonga俯冲带发现(Zhao et al., 1997; Conder and Wiens, 2006). 从目前资料来看,西太平洋深部地幔似乎富水是大家的共识(Komiya and Maruyama, 2007). 实验室数据证明即使少量水也会显著降低橄榄岩和其他上地 幔矿物的有效黏性系数(Hirth and Kohlstedt, 1996). 同时越来越多的证据 (James et al., 2000;Billen and Gurnis, 2001;Hirth and Kohlstedt, 2003; Han et al., 2004;Currie and Hyndman, 2006; Wang, 2007; Panet et al., 2010 )表明俯冲带软流圈黏度相对要低,约1019 Pa·s(Wang et al., 2012). 因此,热岩石圈与地震岩石圈底界差异在华北克拉通自西向东降低主要受太平洋俯冲脱水作用的影响.
太平洋板块俯冲波及到整个中国东部地区,那么,软流圈黏性系数的降低也应该不仅局限于华北东部地区. 在大兴安岭、太行山、雪峰山以东区域的东亚裂谷带,如,渤海湾盆地、松辽盆地,热岩石圈厚度在60~80 km(何丽娟等,2001;汪洋等, 2001),而地震学厚度在80~100 km(朱介寿等,2006; Chen et al., 2009). 下扬子地区的苏北盆地热岩石圈厚度<80 km(李成等,1996),地震学厚度75~100 km(陈沪生,张永鸿,1999). 结果显示这些地区热岩石圈与地震岩石圈厚度差异都相对较小,进一步支持了我们的观点和认识.
(1)二维热传导/对流数值模拟结果显示,流变边界层的厚度主要受软流圈黏性系数(η)的控制,而基本上不受固体岩石圈厚度、岩石圈热状态影响. 软流圈黏性系数越大,流变边界层越厚. 当软流圈黏性系数从1021 Pa·s降到1019Pa·s时,流变边界层厚度从130~90 km减薄至50~30 km,流变边界层的厚度与lg(η)成正比.
(2)全球典型克拉通岩石圈厚度对比显示,地震岩石圈厚度普遍大于热岩石圈厚度,二者的差异很好地揭示了流变边界层的存在.
(3)华北克拉通热岩石圈与地震岩石圈底界的差异自西向东逐渐降低,反映出流变边界层厚度自西向东的减薄, 暗示着华北克拉通岩石圈下部的软流圈地幔黏性系数自西向东逐渐降低. 该结果从一侧面印证了太平洋俯冲脱水作用对华北克拉通破坏的影响. 它表明太平洋板块的俯冲使得大量水进入俯冲带上盘的大地幔楔,造成大地幔楔内黏性系数降低.
| [1] | Anderson D L. 1995. Lithosphere, asthenosphere, and perisphere. Rev. Geophys., 33(1): 125-149. |
| [2] | Artemieva I M, Mooney W D. 2001. Thermal thickness and evolution of Precambrian lithosphere: a global study. J. Geophys. Res., 106(B8): 16387-16414. |
| [3] | Artemieva I M. 2009. The continental lithosphere: Reconciling thermal, seismic, and petrologic data. Lithos, 109(1-2): 23-46. |
| [4] | Billen M I, Gurnis M. 2001. A low viscosity wedge in subduction zones. Earth Planet. Sci. Lett., 193(1-2): 227-236. |
| [5] | Chapman D S, Furlong K P. 1992. Thermal state of the continental lower crust. // Fountain D M, Arculus R, Kay R W, eds. in Continental Lower Crust. Amsterdam-London-New York: Elsevier, 179-199. |
| [6] | Chen H S, Zhang Y H. 1999. Tectonic Characteristics of Lithospheric Structure and Evaluation of Oil and Gas Resources in the Lower Yangtze and Its Adjacent Areas. Beijing: Geological Press. |
| [7] | Chen L, Cheng C, Wei Z. 2009. Seismic evidence for significant lateral variations in lithospheric thickness beneath the central and western North China Craton. Earth Planet. Sci. Lett., 286(1-2): 171-183. |
| [8] | Chen L. 2010. Concordant structural variations from the surface to the base of the upper mantle in the North China Craton and its tectonic implications. Lithos, 120(1-2): 96-115. |
| [9] | Conder J A, Wiens D A. 2006. Seismic structure beneath the Tonga arc and Lau back-arc basin determined fromjoint Vp, Vp/Vs tomography. Geochem. Geophys. Geosyst., 7(3): Q03018. |
| [10] | Cooper C M, Lenardic A, Moresi L. 2004. The thermal structure of stable continental lithosphere within a dynamic mantle. Earth Planet. Sci. Lett., 222(3-4): 807-817. |
| [11] | Currie C A, Hyndman R D. 2006. The thermal structure of subduction zone back arcs. J. Geophys. Res., 111: B08404, doi: 10.1029/2005JB004024. |
| [12] | Dixona J E, Dixona T H, Bellb D R, et al. 2004. Lateral variation in upper mantle viscosity: role of water. Earth Planet. Sci. Lett., 222(2): 451-467. |
| [13] | Doin M P, Fleitout L, Christensen U. 1997. Mantle convection and the stability of depleted and undepleted continental lithosphere. J. Geophys. Res., 102(B2): 2771-2787. |
| [14] | Griffin W L, Ryan C G, Kaminsky E V, et al. 1999. The Siberian lithosphere traverse: mantle terranes and the assembly of the Siberian Craton. Tectonophysics, 310(1-4): 1-35. |
| [15] | Han S C, Sauber J, Luthcke S B, et al. 2008. Implications of postseismic gravity change following the great 2004 Sumatra-Andaman earthquake from the regional harmonic analysis of GRACE intersatellite tracking data. J. Geophys. Res., 113(B11): B11413. |
| [16] | He L J, Hu S B, Wang J Y. 2001. Thermal structure of lithosphere in eastern China. Progress in Natural Science, 11(9): 966-969. |
| [17] | Hirth G, Kohlstedt D L. 1996. Water in the oceanic upper mantle: Implications for rheology, melt extraction and the evolution of the lithosphere. Earth Planet. Sci. Lett., 144(1-2): 93-108. |
| [18] | Hirth G, Kohlstedt D L. 2003. Rheology of the upper mantle and the mantle wedge: A view from the experimentalists //Eiler J, ed. Inside the subduction Factory. American Geophysical Union, 83-105. |
| [19] | Inoue T. 1994. Effect of water on melting phase relations and melt composition in the system Mg2SiO4-MgSiO3-H2O up to 15GPa. Phys. Earth Planet. Inter., 85(3-4): 237-263. |
| [20] | James T S, Clague J J, Wang K, et al. 2000. Postglacial rebound at the northern Cascadia subduction zone. Quat. Sci. Rev., 19(14-15): 1527-1541. |
| [21] | Jaupart C, Mareschal J C. 1999. The thermal structure and thickness of continental roots. Lithos, 48(1-4): 93-114. |
| [22] | Jiao Y X, Qiu N S, Li W Z, et al. 2013. The Mesozoic-Cenozoic evolution of lithospheric thickness in the Ordos Basin: constrained by geothermal evidence. Chinese J. Geophys. (in Chinese), 56(9): 3051-3060. |
| [23] | Kennett B L N, Engdahl E R, Buland R. 1995. Constraints on seismic velocities in the Earth from traveltimes. Geophys. J. Int., 122(1): 108-124. |
| [24] | Komabayashi T, Omori S, Maruyama S. 2004. Petrogenetic grid in the system MgO-SiO2-H2O up to 30 GPa, 1600 ℃: applications to hydrous peridotitesubducting into the Earth′s deep interior. J. Geophys. Res., 109: B03206, doi: 10.1029/2003JB002651. |
| [25] | Komiya T, Maruyama S. 2007. A very hydrous mantle under the western Pacific region: Implications for formation of marginal basins and style of Archean plate tectonics. Gondwana Research, 11(1-2): 132-147. |
| [26] | Lachenbruch A H. 1978. Heat flow in Basin and Range province and thermal effects of tectonic extension. Pageoph., 117(1-2): 34-50. |
| [27] | Lee C T A, Lenardic A, Cooper C M, et al. 2005. The role of chemical boundary layers in regulating the thickness of continental and oceanic thermal boundary layers. Earth Planet. Sci. Lett., 230(3-4): 379-395. |
| [28] | Lei J, Zhao D. 2005. P-wave tomography and origin of the Changbaiintraplate volcano in Northeast Asia. Tectonophysics, 397(3-4): 281-295. |
| [29] | Lewis T J, Hyndman R D, Fluck P. 2003. Heat flow, heat generation, and crustal temperatures in the northern Canadian Cordillera: Thermal control of tectonics. J. Geophys. Res., 108(B6): 2316, doi: 10. 1029/2002JB002090. |
| [30] | Li C, Wang L S, Shi Y S. 1996. Depp thermal state and lithospheric thickness in the lower Yangtze area. Journal of Nanjing University (Natural Sciences), 32(3): 494-499. |
| [31] | Liu S W, Wang L S, Gong Y L, et al. 2005. Thermo-rheological structure of lithosphere in the Jiyang depression and its geodynamical implications. Science in China (D), 35(3): 203-214. |
| [32] | Liu S W, Wang L S, Jia C Z, et al. 2008. Thermo-rheological structure of continental lithosphere beneath major basins in central-western China: implications for foreland basin formation. Earth Science Frontiers, 15(3): 113-122. |
| [33] | McKenzie D P, Bickle M J. 1988. The volume and composition of melt generated by extension of the lithosphere. J. Petrol., 29(3): 625-679. |
| [34] | Milne G A, Davis J L, Mitrovica J X, et al. 2001. Space-geodetic constraints on glacial isostatic adjustment in Fennoscandia. Science, 291(5512): 2381-2385. |
| [35] | Mitrovica J X, Forte A M. 2004. A new inference of mantle viscosity based upon joint inversion of convection and glacial isostatic adjustment data. Earth Planet. Sci. Lett., 225(1-2): 177-189. |
| [36] | Mitrovica J X. 1996. Haskell [1935] revisited. J. Geophys. Res., 101(B1): 555-569. |
| [37] | Morgan P. 1984. The thermal structure and thermal evolution of the continental lithosphere. Physics and Chemistry of the Earth, 15: 107-193. |
| [38] | Ohtani E, Litasov K, Hosoya T, et al. 2004. Water transport into the deep mantle and formation of a hydrous transition zone. Phys. Earth Planet. Inter., 143: 255-269. |
| [39] | Panet I, Pollitz F, Mikhailov V, et al. 2010. Upper mantle rheology from GRACE and GPS postseismic deformation after the 2004 Sumatra-Andaman earthquake. Geochem. Geophys. Geosyst., 11: Q06008. doi: 10.1029/2009GC002905. |
| [40] | Paulson A, Zhong S J, Wahr J. 2007. Inference of mantle viscosity from GRACE and relative sea level data. Geophys. J. Int., 171(2): 497-508. |
| [41] | Petitjean S, Rabinowicz M, Grégoire M, et al. 2006. Differences between Archean and Proterozoic lithospheres: Assessment of the possible major role of thermal conductivity. Geochem. Geophys. Geosyst., 7: Q03021, doi: 10.1029/2005GC001053. |
| [42] | Pollack H N, Chapman D S. 1977. On the regional variation of heat flow, geotherms, and the thickness of the lithosphere. Tectonophysics, 38(3-4): 279-296. |
| [43] | Shi X B, Zhou D, Zhang Y X. 2000. Thermo-rheological structure of lithosphere in the northern margin of South China Sea. Chinese Science Bulletin, 45(15): 1660-1665. |
| [44] | Sleep N H. 2003. Survival of Archean cratonal lithosphere. J. Geophys. Res., 108(B6): doi: 10. 1029/2001JB000169. |
| [45] | Sleep N H. 2006. Mantle plumes from top to bottom. Earth Sci. Rev., 77(4): 231-271. |
| [46] | Turcotte D L, Schubert G. 2002. Geodynamics, Applications of Continuum Physics to Geological Problems. (2nd ed). Cambridge: Cambridge Univ. Press, 456. |
| [47] | Wang K, Hu Y, He J. 2012. Deformation cycles of subduction earthquakes in a viscoelastic Earth. Nature, 484(7394): 327-332. |
| [48] | Wang K. 2007. Elastic and viscoelastic models of crustal deformation in subduction earthquake cycles. //Dixon T H, Moore JC, eds. TheSeismogenic Zone of Subduction Thrust Faults. New York: Columbia University Press, 540-574. |
| [49] | Wang Y, Cheng S H. 2011. Thermal state and rheological strength of the lithosphere beneath the eastern China. Geotectonica et Metallogenia, 35(1): 12-23. |
| [50] | Wang Y, Wang J Y, Xiong L P, et al. 2001. Lithospheric geothermics of major geotectonic units in China mainland. Acta Geoscientia Sinica, 22(1): 17-22. |
| [51] | Zang S X, Liu Y G, Ning J Y. 2002. Thermal structure of the lithosphere in north China. Chinese J. Geophys., 45(1): 56-66. |
| [52] | Zhao D P, Tian Y, Lei J S, et al. 2009. Seismic image and origin of the Changbaiintraplate volcano in East Asia: Role of big mantle wedge above the stagnant Pacific slab. Earth Planet. Sci. Lett., 173(3-4): 197-206. |
| [53] | Zhao D P, Maruyama S, Omori S. 2007. Mantle dynamics of the Western Pacafic and East Asia: Insight from seismic tomography and mineral physics. Gondwana Res., 11(1-2): 120-131. |
| [54] | Zhao D P, Xu Y, Wiens D, et al. 1997. Depth extent of the Lau back-arc spreading center and its relation to subduction processes. Science, 278(5336): 254-257. |
| [55] | Zhu J S, Cai X L, Cao J M, et al. 2006. Lithospheric structure and geodynamics in China and its adjacent areas. Geology in China, 33(4): 793-803. |
| [56] | Zhu R X, Chen L, Wu F Y, et al. 2011. Timing, scale and mechanism of the destruction of the North China Craton. Sci China Earth Sci, 54(6): 789-797, doi: 10.1007/s11430-011-4203-4. |
| [57] | Zhu R X, Yang J H, Wu F Y. 2012. Timing of destruction of the North China craton. Lithos, 149: 51-60. |
| [58] | 陈沪生, 张永鸿. 1999. 下扬子及临区岩石圈结构构造特征与油气资源评价. 北京: 地质出版社. |
| [59] | 何丽娟, 胡圣标, 汪集旸. 2001. 中国东部大陆地区岩石圈热结构特征. 自然科学进展, 11(9): 966-969. |
| [60] | 焦亚先, 邱楠生, 李文正等. 2013. 鄂尔多斯盆地中-新生代岩石圈厚度演化-来自地热学的证据. 地球物理学报, 56(9): 3051-3060. |
| [61] | 李成, 王亮书, 施央申. 1996. 下扬子区深部热状态与岩石圈厚度. 南京大学学报(自然科学版), 32(3): 494-499. |
| [62] | 刘绍文, 王良书, 龚育龄等. 2005. 济阳坳陷岩石圈热一流变学结构及其地球动力学意义. 中国科学D辑地球科学, 35: 203-214. |
| [63] | 刘绍文, 王良书, 贾承造等. 2008. 中国中西部盆地区岩石圈热-流变学结构及其对前陆盆地成因演化的意义. 地学前缘, 15(3): 113-122. |
| [64] | 施小斌, 周蒂, 张毅祥. 2000. 南海北部陆缘岩石圈热-流变结构. 科学通报, 45(15): 1660-1665. |
| [65] | 汪洋, 程素华. 2011. 中国东部岩石圈热状态与流变学强度特征. 大地构造与成矿学, 35(1): 12-23. |
| [66] | 汪洋, 汪集暘, 熊亮萍等. 2001. 中国大陆主要地质构造单元岩石圈地热特征. 地球学报, 22(1): 17-22. |
| [67] | 臧绍先, 刘永刚, 宁杰远. 2002. 华北地区岩石圈热结构的研究. 地球物理学报, 45(1): 56-66. |
| [68] | 朱介寿, 蔡学林, 曹家敏等. 2006. 中国及相邻区域岩石圈结构及动力学意义. 中国地质, 33(4): 793-803. |