 2013, Vol. 56


2. 北京大学地球与空间科学学院,北京 100871
2. School of Earth and Space Sciences, Peking University, Beijing 100871, China
1999年9月21日, 台湾中部南投县集集镇发生了Mw7. 6级大地震, 这是20世纪台湾岛内发生的最大的一次灾难性地震.地震发生在南北向延伸的车笼埔逆冲断层上, 它产生了大约100 km长的地表破裂, 最大垂直和水平位移分别达到了4. 4 m和10. 1 m[1].丰富的震后GPS观测资料显示, 地震之后断层附近地表仍然存在较大的位移(几十到几百毫米), 尤其是在断层的上盘; 除了少数台站之外, 大部分台站记录到的震后地表位移与同震位移的方向一致[2].
大地震之后地表持续变形的现象是在1966年Parkield地震之后逐渐被人们认识到的[3].从20世纪70年代开始, 很多地震都观测到了显著的地表震后变形, 例如1976年Guλtemala地震[4]、1979年ImperialValley地震[5]、1987年Superstition Hills地震[6]等等.目前用于解释早期震后变形的机制主要有两种:一种是黏性松弛机制[7-8], 它假定产生地震的断层区域之下存在一个相对低黏度的软流层, 在地震发生之后, 该层的黏性性质开始发生作用, 它将同震时产生的应力加载释放出来, 这种应力松弛导致了上部地壳的震后运动, 从而产生了地表位移; 另一种机制是震后滑动[9-12], 它假定断层平面上同震破裂区域之外的无震区域的蠕变导致了断层和地表的震后持续运动, 通常用速率状态摩擦准则来描述该蠕变过程[10, 13].
Sheu和Shieh[14]与Hsu等[15-16]、Yu等[2]分别采用运动学正演和反演方法, 探讨了黏性松弛和震后滑动两种机制对台湾集集地震震后地表变形的影响, Sheu和Sheh[14]认为是这两种机制共同作用产生了地表变形, 而Hsu等[15-16]、Yu等[2]则认为主要是震后滑动起作用.朱守彪和蔡永恩[17]利用GPS观测的时间序列反演了地壳和地幔的黏性结构, 认为震后滑动模式难以解释震后变形观测.
为了更好地揭示地表震后变形的力学机制, 与以往的运动学研究不同, 本文从动力学角度, 利用接触问题的黏弹性LDDA方法[18-19], 模拟了台湾集集地震之后450天断层区域及地表的变形场和应力场, 并以GPS观测资料作为约束, 结合速率状态摩擦定律, 考察了黏性松弛和震后滑动两种机制对地表震后变形的影响, 获得了对这一问题的新认识.
2 数值方法本文采用的数值方法是处理接触问题的非线性有限兀方法LDDA (Lagrλngiλn Discontinuous Deformλtionλnalysis)方法[18-19].它将断层视为可以传递应力的位移不连续接触面, 接触面上的滑动满足库仑摩擦强度准则.断层面两侧的接触状态可以分为无滑动摩擦接触、库仑摩擦滑动和非接触三种情况.
LDDA方法从虚功原理出发, 利用断层面上节点的等价集中力来表示分布力, 得到多块体系统的平衡方程为:

|
(1) |
其中, K和F分别是系统的总体刚度矩阵和总体等效节点载荷矢量, G是系数矩阵U和A是待求的总体位移矢量和接触面上的接触力矢量.由于未知量的个数大于方程个数, 因此需要附加断层法向位移变化的约束条件
|
(2) |
其中, GT为系数矩阵G的转置, D0.为接触点对的初始间距矢量.
为了求解满足约束条件(2)的等式(1)的解, 先通过接触判断准则[20]假定某种可能的接触状态, 将(2)式中的不等式转化为等式, 再与(1)式联立, 采用Gauss-Seidel迭代法求得接触力矢量.互相接触的两个平面之间显然不可能存在拉应力.因此, 在迭代过程中, 每一步求出的接触力都要满足以下条件:
(a)法向接触力λn≥0 (规定接触力以压为正, 拉为负).如果得出的λn<0, 表示该接触点对产生了分离, 于是将λn赋为零;
(b)切向接触力|λt|≤μλn, 即|λt |不能大于库仑摩擦剪切强度.如果得出的|λt|>μλn, 表示该接触点对之间产生了滑动, 此时令|λt |=μλn.
如果迭代收敛, 那么最后的收敛值就是求得的接触力矢量Λ.将它代入(1)式就可以求出总体位移矢量U.
该方法在整个求解过程中不需要像运动学模拟那样事先给定断层上的滑动量, 而是根据模型满足的平衡方程、约束条件和载荷严格求解.这样在一定程度上避免了人为设定带来的主观性, 更接近真实情况.同时, 在动力学模拟中还涉及到如何处理断层两侧位移不连续的问题, 本文采用的LDDA方法将断层视为位移不连续的接触面, 这相比将整个研究区域当作连续介质的有限元模拟而言, 更接近真实断层错动的特征.
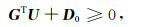
3 力学模型图 1a所示为集集地震震后450天由GPS观测得到的位移分布[2].由图可见, 震后位移在上盘较大, 而下盘则相对小得多.为了采用平面应变模型进行数值模拟, 本文选取位于车笼埔断层中央的垂直剖面(如图中水平线所示)作为研究对象.该剖面附近的台站南北向位移较小, 因此采用二维模型是合理的.

|
图 1 (a)集集地震震后450天内GPS观测的位移分布(据Yuet al[2]修改)(b)有限元几何模型示意图 粗线代表车笼埔断层.(a)中各台站的水平和垂直位移分别用带箭头的实线和空心线表示;断层中部的水平细线代表本文选取的垂直剖面; 本文选取用来做比较的GPS观测台站用椭圆和方框标出. Fig. 1 (a) Distribution of displacements of 450 days after Chi-Chi earthquake from GPS (modified after Yu et al. [2]); (b) Sketchmap of the geometrical model in finite element simulation The bold solid line is the Chelungpu Fautt. In (a) the horizontal and vertical displacements at each station are denoted by solid and hollow llnes with arrow, respectively; the horizontal thin llne m the middle fautt s the vertical profile in this study; the GPS stations compared in this paper are marked by ellipse and pane. |
图 1b为该剖面的有限元几何模型示意图.坐标系选取如图中所示,x和y轴的正向分别代表向东和向上.考虑到断层向东倾斜, 为了消除边界效应[21], 模型的长度在车笼埔断层的东、西方向分别延伸了500 km和450 km, 即总长度为950 km, 深度取岩石圈的平均厚度100 km.模型材料分为弹性上地壳、黏弹性的下地壳和上地幔三层.上地壳和下地壳的边界位于距地表 20 km处[22], Moho面的深度是30 km, 这与三维速度反演得到的30. 25 km的深度[22]非常接近.为了简化, 三层的弹性模量都取为1011Pa, 泊松比为0. 25.上地壳密度为2.7 g/cm3, 下地壳和上地幔密度均为3. 3g/cm3.图 1b中的粗线代表车笼埔断层, 倾角为30°[23], 断层的下端正好位于上地壳和下地壳的分界处[24].模型的左边x方向位移约束, :y方向自由, 底边y方向约束, :x方向自由.右边施加位移边界条件, 给定水平向西的均匀位移来模拟板块运动产生的构造应力场.为了较为准确地计算断层面上的接触力, 将断层附近及尖端进行了网格加密.
接触问题是非线性问题, 初始应力场直接影响断层上的接触状态(比如是否产生了滑动), 因为采用库仑摩擦准则判断接触点对是否滑动时利用的是总的剪应力大小.本文考虑了重力对断层面应力场的影响, 它在迭代求解每一步接触力的同时参与接触判断, 即采用总的法向和切向接触力来判断接触点对的接触状态.
为了单独探讨黏性松弛和震后滑动两种机制对震后变形的影响, 模拟黏性松弛机制时, 下地壳和上地幔的黏度由GPS观测数据约束来得到; 模拟震后滑动机制时, 整个岩石圈均采用弹性材料, 并利用速率状态摩擦定律来描述震后滑动机制[10, 13], 即地震之后断层面上的摩擦系数满足Dieterich-Ruina定律[13, 25-26]:
|
(3) |
|
(4) |
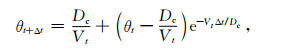
其中, μ0是以某一参考速度V0作稳定滑动时的摩擦系数, V为滑动速度, Dc为临界滑动位移, θ为状态参量[26], a和b为与材料性质有关的摩擦参数.将(3)、(4)两式对时间做离散化t+Δt寸刻的状态参数θt+Δt和摩擦系数可用t时刻的参量表示如下:
|
(5) |
|
(6) |
式中各参数对计算结果的影响详见付真[19].计算取a > b, 即将断层面看作速度强化区域[13].这样, 给定初始速度和状态参数, 即可根据(5)、(6)两式得到摩擦系数随时间的变化, 并进一步计算由此产生的地表位移场, 从而描述震后滑动机制对地表震后变形的影响.
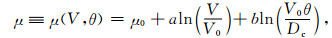
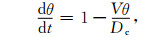
4 数值模拟结果 4.1 黏弹性模型结果首先根据GPS观测资料采用试错法确定下地壳和上地幔的黏度.以剖面附近的台站5936为例(见图 1a中的矩形框).取上地幔黏度为1020Pa·s, 图 2显示了下地壳黏度分别为1017、1018、1019、1020Pa·s的地表台站5936处的位移数值解和观测数据的比较, 结果显示当下地壳黏度为1017 Pa·s时, 计算结果与观测数据吻合得最好.其中, 黏度1018Pa·s的结果与观测吻合也较好, 但相比1017 Pa·s要略微差一些.1019Pa·s和1020Pa·s的计算结果则显示出这两个下地壳黏度值的不合适.然后选取下地壳黏度为1017Pa·s, 图 3显示了上地幔黏度分别为1020, 1021、1022、1023 Pa·s的计算结果与观测的比较曲线, 由图可见, 上地幔的黏度值选取不同对结果的影响很小, 这是由于一方面上地幔层在深度上相对于下地壳而言距离断层和地表较远, 因而对地表位移的影响较下地壳要小; 另一方面, 上地幔的松弛时间相对下地壳要长, 450天对上地幔而言是一个较小的时间尺度, 因此该阶段的地表位移对上地幔黏度值的改变不如下地壳敏感.因此, 根据GPS观测数据只能确定最合适的下地壳黏度为1017Pa·s, 无法确定上地幔黏度, 为方便起见, 在此后的计算中统一取上地幔黏度为1020Pa·s, 下地壳黏度为1017Pa·s.

|
图 2 台站5936(见图 1a中的方框)处不同下地壳黏度的计算结果与GPS数据[2]的比较 图中实线代表数值计算结果,圆圈代表GPS数据.横坐标代表震后的时间,单位为天,纵坐标代表水平或垂直位移. Fig. 2 Comparisons of computed displacements at station 5936 (shown in Fig. 1a with a pane) for different viscosities of the lower crust with GPS data[2] The solid lines are numerical results and the circles are GPS data. The horizontal axis stands for the time after the earthquake, the untt of the time is day and the vertical axis is horizontal or vertical displacement. |

|
图 3 同图 2, 但为台站5936(见图 1a中的方框)处不同上地幔黏度的计算结果与GPS数据[2]的比较 Fig. 3 Same as Fig. 2, but for comparisons of computed displacements at station 5936(shown inFig. 1awith apane) for different viscosities of the upper mantle with GPS data[2] |
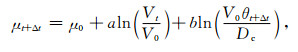
利用确定的下地壳和上地幔黏度, 可以计算震后450天内整个模型区域(包括断层面上)的位移场和应力场.由于数据有限, 本文选取剖面附近的五个台站进行比较(见图 1a中的椭圆和矩形框所示).上盘的四个台站分别是5936, HTZS, AF30和S167, 下盘的一个台站是A247.图 4显示了上盘和下盘台站处计算得到的震后位移与GPS观测数据[2]的比较.由图可见, 计算结果与观测值吻合得非常好.这表明了模型及参数选取的合理性, 较好地反映了震后变形的主要特征.

|
图 4 同图 2, 但为上盘(5936、HTZS、AF30和S167)和下盘(A247)台站处计算得到的位移与GPS数据[2]的比较 Fig. 4 Same as Fig. 2, but for comparisons of computed displacements at stations 5936, HTZS, AF30 and S167 on the hanging wall and station A247 on the footwall with GPS data[2] |
数值计算还得到了断层面及附近区域的剪应力分布及其演化, 图 5显示了断层附近150 km宽的区域内沿断层面方向剪应力在震前和震后不同时刻的空间分布图.震前区域内的应力场是均匀的, 但断层面上的剪应力大小并不均匀, 因为有初始场的存在.地震刚结束时, 断层上出现了明显的剪切应力降, 且沿断层两侧是近乎对称分布的, 但断层尖端有应力集中.数据结果显示断层面上的剪切应力降分布并不均匀, 平均值大小约为4 MPa, 这与Zhang等[27]根据震源动力学研究得到的应力降平均值约为5 MPa的结果非常接近.地震之后225天时, 断层附近区域内部的应力开始慢慢调整, 由于下地壳黏度较低, 该层的应力逐渐松弛, 应力值相对地震刚结束时明显要小, 之后的更长时间里(450天), 区域内的剪应力改变很小, 但断层面上的剪应力又逐渐积累, 开始孕育下一个新的地震事件.

|
图 5 断层垂直剖面区域震前和震后不同时刻断层面上剪应力等值线的空间分布 图中的黑色实线代表车笼埔断层,横纵坐标代表空间点在图 1b所示坐标系中的坐标值.地震之后断层尖端产生了应力集中,但断层面上出现了应力降. Fig. 5 Distribution of the shear stress on the fautt at different time before and after the earthquake on the verticll profile in Fig. 1a The black solid line is the Chelungpu Fault and the horizontal and vertical axis stand for the coordinate of the space point in coordinate system in Fig. 1b. After the earthquake, stress concentration occurs at the fault tp, but on the fault stress drop is obvious. |
结合LDDA方法和(5)、(6)两式, 可以计算得到由速率状态摩擦定律描述的震后滑动机制对集集地震震后地表变形的影响.根据Marone的震后滑动模型[13], 震后断层面为速度强化区域, (5)、(6)两式中各参数的取值参考实验室测量[28]及数值研究结果[19, 29-30].将图 1b中模型的岩石圈介质设为弹性材料, 以便与黏性机制对结果的影响区分开来.计算震后450天的地表位移, 图 6为AF30、HTZS和A247三个台站的计算结果与观测的比较曲线, 二者的变化趋势在震后最初的大约50天内吻合较好, 但在震后450天的整体趋势上并不一致, 且震后地表位移在大约50天后逐渐达到稳定, 不再随时间变化, 这一点显然与观测数据不符.这是由于忽略了地下介质的黏性变形而只考虑弹性导致的, 因此, 忽略黏性松弛仅用震后滑动机制难以解释集集地震的地表震后位移.

|
图 6 三个台站处(AF30、HTZS和A247)计算得到的震后位移曲线与GPS记录[2]的比较 图中实线代表数值计算结果,圆圈代表GPS数据.横纵坐标含义同图 2.计算结果与观测数据只在震后几十天内吻合,约50天后地表位移基本不随时间变化,但观测数据显示直到震后450天地表位移仍在增加. Fig. 6 Comparisons of computed postseismic displacements at three stations (AF30, HTZS and A247) with GPS data[2] Solid lines are the numerical results, and circles stand for GPS data. Horizontal and vertical coordinates are the same as those in Fig. 2. Computed results are consistent with recorded data only in tens of days, and the displacement on the ground almost remains unchanged after 50 days after the earthquake. However, observed data indicate that the displacement on the ground increases even 450 days after the earthquake. |
基于接触问题的黏弹性LDDA方法将断层看作两个接触的平面, 采用接触判断准则, 可以十分方便地求解出模型区域和断层面上的位移和应力, 以及它们随时间的演化规律.将该方法应用于1999年台湾集集地震的震后变形模拟, 得到了以下结论:
黏弹性力学模型的计算结果与观测数据非常吻合, 表明黏性松弛机制是影响震后地表位移的重要因素, 通过试错法由震后GPS观测约束得到的下地壳黏度为1017Pa·s, 而上地幔黏度对计算结果影响不大.基于速率状态摩擦定律中的速度强化模型, 结合LDDA方法模拟震后滑动机制对地表变形的影响, 结果显示震后滑动机制不能很好地解释震后450天的观测数据, 它只在震后50天内与观测大致吻合, 之后位移值基本不随时间变化.
部分反演研究结果显示车笼埔断层下方存在近水平的滑脱面[2, 31], 且它在集集地震后产生了滑动.然而, 采用本文的数值方法, 通过大量数值计算试验, 结果显示水平滑脱面的震后滑动对地表变形的影响很小, 可以忽略.因而考虑到对结果影响不大, 为简单起见, 本文将断层简化为图 1b所示的模型.本文通过动力学模拟的最新研究, 获得了1999年台湾集集地震震后变形机制的新认识, 尽管基于本文采用的数值方法计算得到的结果支持黏性松弛机制, 不支持单独的震后滑动机制, 但对该问题的最终定论还需进一步的研究.
致谢感谢评审专家提出的宝贵意见.
| [1] | Yu S B, Kuo L C, Hsu Y J, et al. Preseismic deformation and coseismic displacements associated with the 1999 ChiChi, Taiwan, earthquake. Bull. Seism. Soc. Am. , 2001, 91(5): 995-1012. |
| [2] | Yu S B, Hsu Y J, Kuo L C, et al. GPS measurement of postseismic deformation following the 1999 Chi-Chi, Taiwan, earthquake. J. Geophys. Res. , 2003, 108: 2520. DOI:10.1029/2003JB002396 |
| [3] | Smith S W, Wyss M. Displacement on the San Andreas fautt subsequent to the 1966 Parkfield earthquake. Bull. Seism. Scc. Am. , 1968, 58(6): 1955-1973. |
| [4] | Bucknam R C, Plafker G, Sharp R V. Fault movement (afterslip) following the Guatemala earthquake of February 4, 1976. Geology , 1978, 6(3): 170-173. DOI:10.1130/0091-7613(1978)6<170:FMAFTG>2.0.CO;2 |
| [5] | Harsh P W. Distribution of afterslip along the imperial fault. The Imperial Valley Earthquake of October 15, 1979, US Geol. Surv. Prof. Pap. , 1982, 1254: 193-203. |
| [6] | Sharp R V, Budding K E, Boatwright J, et al. Surface faulting along the Superstition Hills fautt zone and nearby faults associated with the earthquakes of 24 November 1987. Bull. Seism. Scc. Am. , 1989, 79(2): 252-281. |
| [7] | Wahr J, Wyss M. Interpretation of postseismic deformation with a viscoelastic relaxation model. J. Geophys. Res. , 1980, 85(B11): 6471-6477. DOI:10.1029/JB085iB11p06471 |
| [8] | Deng J S, Gurnis M, Kanamori H, et al. Viscoelastic flow in the lower crust after the 1992 Landers, California, earthquake. Science , 1998, 282(5394): 1689-1692. DOI:10.1126/science.282.5394.1689 |
| [9] | Shen Z K, Jackson D D, Feng Y J, et al. Postseismic deformation following the Landers earthquake, California, 28 June 1992. Bull. Seism. Soc. Am. , 1994, 84(3): 780-791. |
| [10] | Marone C J, ScholzC H, Bilham R. On the mechanics of earthquake afterslip. J. Geophys. Res. , 1991, 96(B5): 8441-8452. DOI:10.1029/91JB00275 |
| [11] | Hsu Y J, Bechor N, Segall P, et al. Rapid afterslip following the 1999 Chi-Chi, Taiwan earthquake. Geophys. Res. Lett. , 2002, 29(16): 1-4. DOI:10.1029/2002GL014967 |
| [12] | Savage J C, Svarc J L. Postseismic deformation associated with the 1992 Mw7. 3 Landers earthquake, southern California. J. GeoPhys. Res. , 1997, 102(B4): 7565-7577. DOI:10.1029/97JB00210 |
| [13] | Marone C. Laboratory-derived friction laws and their application to seismic faulting. Ann. Revs. Earth Plant. Sci. , 1998, 26: 643-696. DOI:10.1146/annurev.earth.26.1.643 |
| [14] | Sheu S Y, Shieh C F. Viscoelastic-after slip concurrence:a possible mechanism in the early post-seismic deformation of the Mw7.6, 1999 Chi-Chi (Taiwan) earthquake. Geophys.J.Int , 2004, 159(3): 1112-1124. DOI:10.1111/gji.2004.159.issue-3 |
| [15] | IIsu Y J, Bechor N, Segall P, et al. Geophys. Res. her. , 2002, 29(16): 1-4. DOI:10.1029/2002GL014967 |
| [16] | Hsu Y J, Segall P, Yu S B, et al. Temporal and spatial variations of post-seismic deformation following the 1999 ChiChi, Taiwan earthquake. Geophys.J.Int. , 2007, 169(2): 367-379. DOI:10.1111/gji.2007.169.issue-2 |
| [17] | 朱守彪, 蔡永恩. 利用GPS观测的时间序列资料反演地壳地幔黏性结构. 地球物理学报 , 2006, 49(3): 771–777. Zhu S B, Cai Y E. Inversion of viscous properties of crust and mantle from the GPS temporal series measurements. Chinese J.Geophys. (in Chinese) , 2006, 49(3): 771-777. |
| [18] | Cai Y E, He T, Wang R. Numerical simulation of dynamic process of the Tangshan earthquake by a new method-LDDA. Pure Appl. Geophys. , 2000, 157(11): 2083-2104. DOI:10.1007/PL00001076 |
| [19] | 付真.接触问题的粘弹性LDDA方法及其在震后变形机制研究中的应用[博士论文].北京:北京大学, 2008. Fu Z. Viscoelastic LDDA method for contact problems and its applications to studies on mechanism of postseismic deformation [Ph. D. thesis] (in Chinese). Beijing: Peking University, 2008. |
| [20] | Shi G I, Goodman R E. Two-dimensional discontinuous deformation analysis. Int J.Numer. Anal. Meih. Geomech. , 1985, 9(6): 541-556. DOI:10.1002/(ISSN)1096-9853 |
| [21] | Fu Z, Cai Y E. Numerical analysis on the influence of rock specimen size on crack stress field. Acta Seismologica Sinica , 2005, 18(3): 322-330. |
| [22] | Ma K F, Wang J H, Zhao D P. Three-dimensional seismic velocity structure of the crust and uppermost mantle beneath Taiwan. J. Phys. Earth , 1996, 44(2): 85-105. DOI:10.4294/jpe1952.44.85 |
| [23] | Shin T C, Teng T L. An overview of the 1999 Chi-Chi, Taiwan, Earthquake. Bull. Seism. Sec. Am. , 2001, 91(5): 895-913. |
| [24] | Tse S T, Rice J R. Crustal earthquake instability in relation to the depth variation of frictional slip properties J Geophys. Res. , 1986, 91(B9): 9452-9472. |
| [25] | Dieterich J H. Modeling of rock friction: 1. Experimental results and constitutive equations. J. Geophys. Rss. , 1979, 84(B5): 2161-2168. |
| [26] | Ruina A L. Slip instability and state variable friction laws. J. Geophys. Res. , 1983, 88(B12): 10359-10370. DOI:10.1029/JB088iB12p10359 |
| [27] | Zhang W B, Iwata T, Irikura K, et al. J. Geophys. Rss. , 2003, 108(B5): 2232. DOI:10.1029/2002JB001889 |
| [28] | Blanpied M L, Lockner D A, Byerlee J D. Frictional slip of granite at hydrothermal conditions. J Geophys Res , 1995, 100(B7): 13045-13064. DOI:10.1029/95JB00862 |
| [29] | Fukuda J, Johnson K M, Larson K M, et al. Fautt friction parameters inferred from the early stages of afterslip following the 2003 Tokachi-Oki earthquake. J. Geophys. Res. , 2009, 114(B4): B04412. DOI:10.1029/2008JB006166 |
| [30] | Kato N, Yoshida S. A shallow strong patch model for the 2011 great Tohoku-Oki earthquake: A numerical simulation. Geophys. Res. Ler. , 2011, 38(7): L00G04. DOI:10.1029/2011GL048565 |
| [31] | Johnson K M, Segall P, Yu S B. A viscoelastic earthquake cycle model for Taiwan. J. Geophys. Res. , 2005, 110: B10404. DOI:10.1029/2004JB003516 |