 2012, Vol. 55


古老克拉通是地球上相对稳定的构造单元,通常具有密度和热流值低、刚性的特点,多具有>200km的巨厚岩石圈根[1].然而,华北克拉通是个例外.相对于世界上其他克拉通,华北克拉通具有独特的壳幔结构.基于岩石组成、构造样式、地球化学特征、同位素年龄及变质作用P-T演化方面的差异,华北克拉通分为西部陆块、东部陆块和中部带[2].西部陆块也叫鄂尔多斯块体,具有厚的稳定的克拉通型的岩石圈根;相对于长期构造稳定的西部陆块,东部陆块自中生代以来遭受了强烈的改造,发生了大规模的构造变形、岩浆活动和盆地形成,致使其原有的克拉通结构和性质遭到明显的破坏,岩石圈厚度从太古代或原生代的>200km 减小到目前的约80km;中部带是西部陆块和东部陆块的碰撞造山带,其东边界接近南北重力梯度带[2].一些研究通过对比南北重力梯度带两侧的地壳厚度、地形高度、重力异常、岩石组成认为南北重力梯度带是中生代-新生代华北克拉通减薄的最西界线[3-6].然而,中生代-新生代火山活动研究表明中部带也遭受了破坏.有关华北克拉通破坏的时间演化和空间分布一直受到广泛的关注[7-13].诸如克拉通下的上地幔变形和与板块运动有关的软流圈地漫流等基本特征对理解华北克拉通的演化具有重要的意义.
地震各向异性是一种测量地壳和上地幔变形的有效方法.上地幔各向异性一般被认为是由于形变导致地幔橄榄岩中的晶格优势排列引起的,反映了过去和现在的构造运动产生的大陆下岩石层中的内部变形,因此通过各向异性的研究可以推测地球内部物质运动模式[14-16].横波分裂现象是各向异性在地震波形记录中最明显的表现形式.快波偏振方向和快、慢波的时间延迟这两个分裂参数分别反映了地幔变形的方向和强度.因此,各向异性研究不仅可以用来分析板内变形特征,而且可以用来探测与板块运动有关的岩石圈或软流圈变形模式.在华北地区,一些作者利用华北地区的固定台站和宽频带地震剖面流动台站记录的SKS 波形数据分析了该区的上地幔各向异性特征,得到了一些重要的结果[17-24].然而,由于有限的数据,对深入研究华北上地幔各向异性还是初步的.近期,华北地震科学台阵项目的实施,使得华北地区形成了稠密和分布均匀的地震观测网络,并获得了大量高质量的宽频带数字地震记录,它将有助于华北上地幔各向异性特征和动力学研究的深入.
2 数据和方法地震资料来自于华北地震科学台阵的190个宽频带台站和10个甚宽带台站的(图 1和表 1中台站名以“V"开头的代表甚宽带台站,其余为宽频带台站).华北地震科学台阵是中国地震局地球物理研究所在2006年到2009年期间在华北地区实施的大型科学项目,该项目在华北地区布设了250 个地震台站,其中包括190个宽频带流动地震台站(地震计为CMG-3ESPC,频带范围为50 Hz~60s)和10个甚宽带地震台站(地震计为CMG-3T,频带范围为50Hz~120s, 地震计放置在固定台站的台基上).远震事件选取的标准是:震级大于5.5 级的深源地震(震源深度>150km)或震级大于6 级的浅源地震(震源深度小于<150km),震中距在85°~115°范围内.本研究总共选取了48 个远震事件.图 1 中的右上图显示了本文用于SKS(SKKS)波分裂测量的地震事件分布.地震事件主要集中在南太平洋地区的斐济-汤加一带,其他地区也有一定分布,总体上事件方位分布满足研究要求.在S波分裂测量前,我们对数据进行了分析,特别是利用P 波极性分析方法[25]对由于磁偏角等原因造成的仪器水平N 和E分量与地理北、东方位的偏差进行了矫正.检验结果表明,只有极个别的台站存在方位偏差,例如A502,说明华北地震科学台阵的原始数据可信度很高.

|
图 1 研究区构造背景和台站分布图 (a)华北克拉通构造分区图[2],图中虚线为分界线,将华北克拉通分为西部陆块、中部带和东部陆块,长方形代表研究区;(b)显示了用于 SKS分裂研究的地震事件震中分布,图中红色圆点代表用于研究的远震,黄色长方形代表研究区的位置.(c)200个流动台站分布,图中黑色圆点代表流动台站,粗灰线代表重力梯度带. Fig. 1 Regional geologic setting of the study area and location of stations (a)A larger scale map of NCC with three-fold subdivision[2].The thick dashed lines mark boundaries within the NCC,i.e.,the Eastern Block, Central Block and Western Block.The rectangle represents the study region.(b) Epicenters of events used in SKS splitting measure.The red circles denote the teleseismic events.The yellowpane represents the location of the study region.(c) The locations of 200 temporary stations used in this study.The black solid circles denote the stations.The thick grey line represents the North-South Gradient Line. |
本文使用的SKS(SKKS)波分裂分析方法基本步骤是:首先用最小切向能量的网格搜索法[26]分析不同方位的单个事件确定的各向异性参数对(φ,δt)及其误差,误差估计采用95% 的置信度;然后对由一组由远震事件得到的台站下方各向异性参数做“叠加"处理[27],它类似于[28]提出的分裂参数法.对于不同信噪比、从不同方位来的远震SKS 波,这种方法能够提高结果的可靠性,方法的详细叙述见已发表文献[19, 21].对于干扰背景较大的台站,效果尤为明显.因此,“叠加"分析是提高台站SKS(SKKS)波分裂测量质量的一种有效方法[29].
图 2显示了对2007 年10 月16 日21 点05 分斐济群岛Mw6.6 地震在K004 台的记录所作的SKS波分裂分析.图 2a中切向分量明显,说明SKS波在传播路径上遇到各向异性介质层,发生分裂,使得SKS波转到快、慢轴方向上的快、慢波形相似(图 2c),且快、慢波的质点运动轨迹变为图 2d中的椭圆偏振.对不同的(φ,δt)重建的理论图中的切向能量画出等值线图 2g,从图 2g中找到切向能量最小值(即星号对应的位置),其相应的(φ,δt)即为所求的各向异性参数对.由图 2b可见,经过各向异性校正后的地震记录,其切向分量已变得很小,图 2e中校正后的快、慢波起始相位也变得基本一致,并且图 2f中快、慢波的质点运动轨迹也由椭圆变成了直线.这些说明计算出的分裂参数具有较高的可靠性.图 3显示了K004台从2个远震事件(2008年09月01日04点00分Mw6.0;2009年04月18日17点56分Mw5.7)获得的SKS 波分裂分析结果与使用“叠加"处理后结果的比较,这两个分裂参数误差较大的事件经过叠加之后,最终分裂参数的误差明显减小.

|
图 2 SKS波分裂分析示例 (a)、(b)分别为原始和经过各向异性校正后的SKS震相转到径向(R)和切向(T)上的波形;(c)、(d)分别为将原始SKS震相转到快波(F)和慢波(S)轴方向的波形和质点运动轨迹;()、() 分别经过各向异性校正后SKS震相在快波和慢波轴方向的波形和质点运动轨迹;(g)为切向能量等值线图. Fig. 2 An example of SKS splitting analysis at station K004 Original SKS phase (a) and corrected SKS phase (b) in the radial-transverse coordinate system; original SKS phase (c) and particle motion of the original SKS phase (d) in the fast-slow coordinate system; corrected SKS phase (e) and particle motion of the corrected SKS phase (f) in the fast-slow coordinate system; contour plot of energy (g) on the transverse component. |

|
图 3 K004台单个远震事件SKS波分裂分析的切向能量等值线图(a)和(b)以及由这两个事件叠加得到的切向能量等值线图(c),图中星号表示最佳分裂参数的位置 Fig. 3 Transverse energy contour of SKS splitting analysis at station K004 from two teleseismic events (a) and (b),and the transverse energy contour of the result after stacking (c).The asterisk denotes the position of optimal parameter pair |
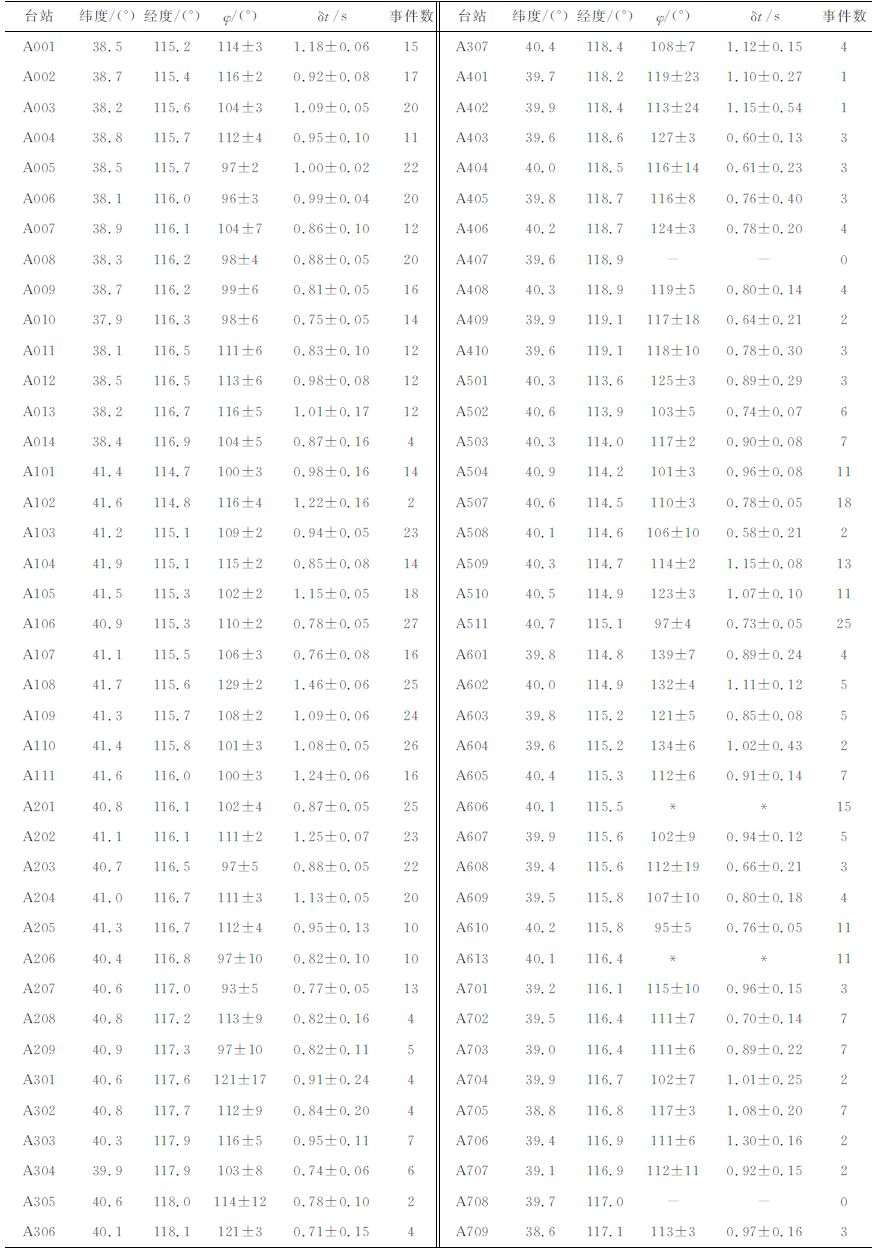
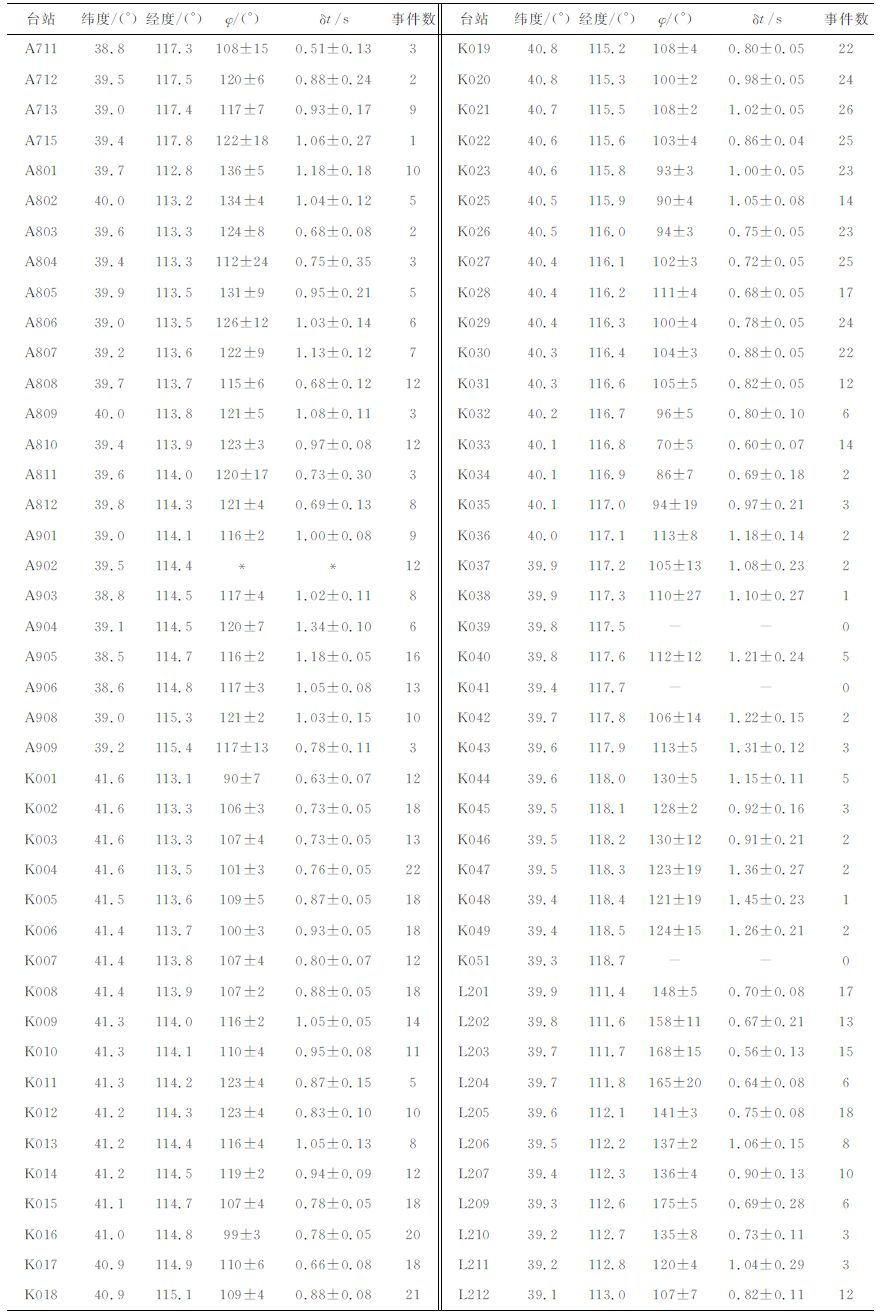
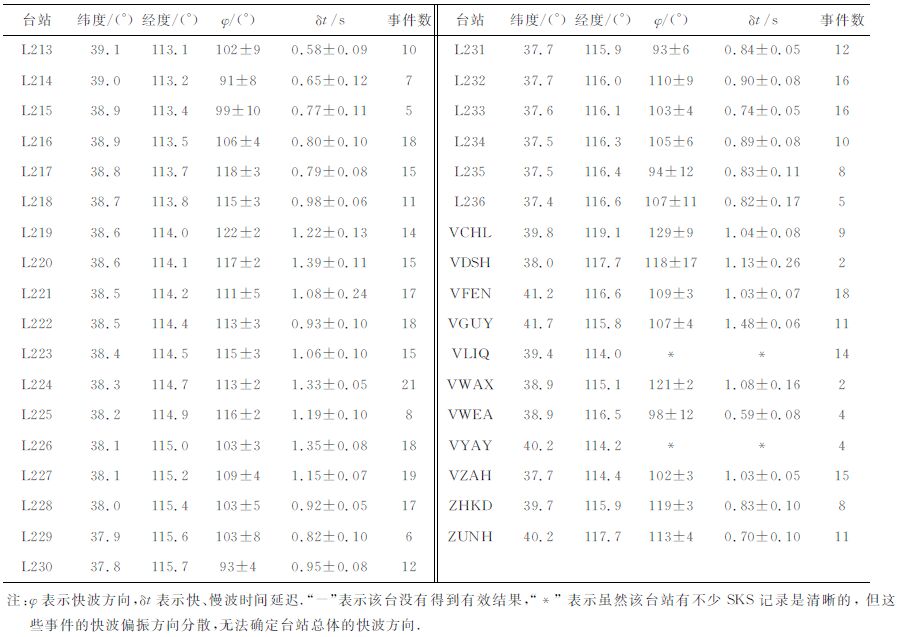
表 1列出了华北地震科学台阵200个台站下方的各向异性参数.流动台站虽然观测条件有限,但近两年半的观测获得可用于SKS(SKKS)波分裂分析的远震记录较多,并且在单个事件分析的基础上进行“叠加"分析,因而多数台站的分裂测量结果比较好.从表 1看出,大多数台站的测量结果质量都比较高,其快波方向的误差在10°以内,时间延迟的误差在0.2s以内.但是由于个别台站记录的数据质量差,造成了A407 台、A708 台、K039 台、K041 台和K051台5个台站没有找到适合SKS分裂的事件波形记录,没有得到有效结果.A606 台、A613 台、A902台、VLIQ 台和VYAY 台5 个台站得到的各向异性参数离散大,不能用于叠加分析,没有得到最终结果,可能原因是这5 个台站下方构造异常复杂(如多层各向异性或存在倾斜界面等)或者台站资料记录方面造成的,由于事件方位分布的限制,未能对其进行进一步的分析.
|
|
表 1 华北各台站SKS波分裂参数 Table 1 Splitting parameters for SKS phases in the North China |
根据华北地震科学台阵各台站的远震SKS(SKKS)波形资料的偏振分析结果,并结合本文作者已经发表过的固定台站的结果[19-21],我们绘制了华北地区的上地幔各向异性图像(图 4).从图 4 中看,不仅放置在国家台网固定台站的科学台阵甚宽带地震仪记录资料的结果与固定台站的结果一致,而且流动宽频带台站的结果与其邻近的固定台站的结果也基本一致.根据快波方向趋势的分布,如图 5所示以蓝色虚线为界,研究区基本可划分为两个部分,即华北东部和华北西部.按照快波方向趋势分布划分的华北西部主要位于研究区华北克拉通西部陆块的南部,而华北东部包括研究区华北克拉通的东部陆块、中部陆块和西部陆块的北部,蓝色分界线基本上与华北克拉通中西部的分界线一致.华北东部的快波方向趋势为NWW-SEE,而在华北西部快波方向转为NW-SE 方向和NNW-SSE 方向.快、慢波时间延迟范围是0.50~1.47s.华北西部的各向异性参数平均值为(152°,0.79s),华北东部的各向异性参数平均值为(110°,0.97s).整体上,华北西部的快、慢波时间延迟小于华北东部的.

|
图 4 华北上地幔各向异性结果分布图 黑色和红色直线段分别代表流动台站和以前发表的固定台站[19-21]得到的分裂测量结果,线段方向(以正北顺时针转)表示快波方向,线段长度表示快、慢波时间延迟大小;黑色星号代表台站得到的快波方向离散度大;蓝色粗箭头表示绝对板块运动(APM)测量结果. Fig. 4 Anisotropic image of upper mantle beneath North China Black bars and red bars represent the splitting measurements at temporary stations and permanent stations[19-21] , respectively.The orientations and length of bars indicate the fastpolarization direction and the delay time, respectively.Theblackasterisksdenotethefast-wave directions are scattering atthe station.Blue arrows represent l^he APM directions. |

|
图 5 华北各向异性特征分区图 蓝色虚线为基于各向异性特征划分的华北东部和西部的分界线,黑色线段为快波方向和绝对板块运动方向差值小于20°的台站的结果,红色线段为快波方向和绝对板块运动方向差值大于20°的台站的结果. Fig. 5 Anisotropic characteristics division map in the North China Blue dashed line denotes the boundary between the Eastern North China and Western North China based on anisotropic characteristics.Black bars represent the results within 20° of difference between the azimuth of the fast polarization direction and the azimuth of APM direction; red bars represent the results outside 20° of difference. |
我们将研究区得到的结果与其他研究者在相同区域结果进行了比较.在本文的研究区内,一些文献[22-25]中提到的固定台站测量的结果与本文的固定台站结果或相近的流动台站结果相一致,但是Zhao等[17, 18]测量的相当一部分台站结果与本文相同台站或相近区域内的台站结果差异较大.比如本文由6个事件得到A904台的测量结果是(120°,1.34s),而Zhao等[17]在A904 台附近的187 台由1 个事件得到的结果是(22°,0.7s),二者差异较大.这种差异可能是由于Zhao等[17]用于研究的事件有限,以及资料处理和选择标准的不同造成的.
4 讨论和结论 4.1 各向异性成因上地幔各向异性是由于形变导致地幔橄榄岩中的晶格优势排列引起的,因此横波分裂测量结果直接反映了上地幔变形和地幔流动场的特征[30].基于研究区绝大多数快波方向平行于绝对板块方向,一些学者认为各向异性主要是现今地幔流引起的[31-32].在华北东部,由HS3-NUVEL1a模型[33]求取相对于热点参考系的绝对板块运动(APM)(图 6)的运动方向是NWW 方向(约N288°E),这一区域内绝大多数台站的快波方向与APM 相一致(二者残差小于20°,均方差在6 ± 5°),反映了华北东部下的地幔流对产生该区域上地幔各向异性有着重要的作用.
在华北东部的东部陆块,地壳厚度为30~40km[34-35],上地壳各向异性产生的平均慢横波时间延迟约为3.5ms/km[36].假设东部陆块地壳产生的平均慢波时间延迟也是3.5ms/km, 可以估算由40km 厚度的地壳产生的最大的时间延迟为0.14s, 远小于该区域各台站由SKS(SKKS)分裂计算得到的平均值为1s的快、慢波时间延迟,所以地壳对SKS(SKKS)分裂分析的影响很小.东部陆块大量的地球化学和地球物理研究结果[3, 37-38]显示了一个减薄的岩石圈结构,岩石圈厚度范围是60~80km, 那么壳下岩石圈为30~40km.而东部陆块平均值为1s的时间延迟对应了各向异性度为3%[24]的150km厚的各向异性层.因此,即使假设地壳和壳下岩石圈变形一致,整个岩石圈不足以产生我们在东部陆块所观测的快、慢波分裂延迟.中国大陆的面波各向异性结果表明,在东部陆块大约深度为70~150km范围内各向异性较强,推测在岩石圈底部和软流圈顶部存在显著的水平运动和较大的运动梯度[39].因此,岩石圈对东部陆块上地幔各向异性产生的影响有限,由APM 引起的软流圈内地幔流是引起各向异性的主要原因.
对于华北东部的中部带,NWW 趋向的快波方向并不平行于NE 或NEE 趋向的区域地表构造走向,而是与东部陆块的快波方向趋势一致,都平行于APM 方向,表明华北克拉通中东部具有相同的上地幔各向异性特征.面波成像的结果显示中部带和东部陆块的平均岩石圈厚度分别为约80km 和60km[40].接收函数结果显示中部带的岩石圈厚度为80~100km[41],而东部陆块的岩石圈厚度为60~80km[38, 42].多种方法综合研究的结果表明中部带和东部陆块的岩石圈-软流圈转换带不超过100km[4, 8, 43-44].这些研究结果显示中部带和东部陆块的岩石圈厚度差别较小,都比较薄,对应了我们在二个区域内观测所得到的相一致的分裂结果.我们的结果支持了中部带在中生代和新生带也经历了岩石圈的活化过程,岩石圈遭到了破坏.与东部陆块一样,由APM 驱动的NWW 趋向的软流圈地幔流是造成中部带的上地幔各向异性的主要原因,它使得上地幔橄榄岩等晶体的晶格优势取向沿地幔物质流动方向,从而导致了NWW 趋向的快波方向.
研究区内西部陆块的北部和南部表现出不同趋势的快波方向,北部的快波方向与中部带和东部陆块的快波方向一致,体现了一致的各向异性特征.由于西部陆块的中部没有资料,我们未能了解北部和南部是如何过渡的,这需要在后续的宽频带地震流动观测资料得到的分裂结果来分析.我们注意到,在中部带及其与东部陆块和西部陆块的分界线两侧,局部地区的部分台站表现出特殊的各向异性特征,即小部分台站的各向异性参数离散较大或快波方向与分区内总的快波方向趋势不一致,这可能与局部地区特殊的构造有关,如岩浆(火山)活动.
相对于遭受了克拉通岩石圈破坏的华北东部,华北西部(即研究区西部陆块的南部),属于稳定的鄂尔多斯克拉通块体.鄂尔多斯块体被认为仍然保留了古老华北克拉通厚的岩石圈根.面波成像和P波走时成像显示了鄂尔多斯块体下面存在着高速的大陆根,厚度大于200km[34, 45-46].华北西部的快、慢波时间延迟平均值为0.79s, 小于华北东部0.97s的时间延迟平均值,且华北西部大部分台站的时间延迟小于全球平均值1s[31],暗示了稳定的鄂尔多斯块体具有弱的各向异性.华北西部NW-SE 或NNW-SEE 方向的快波方向既不平行于APM 方向,也不平行于NE 或NEE 趋向的区域地表构造走向.“化石"各向异性主要存在于大陆构造稳定的单元,保留了地幔变形历史信息[26].华北西部的弱各向异性很可能是遗留在古老克拉通厚的岩石圈内遗留的“化石"各向异性造成的.
4.2 结论通过对科学台阵的200个流动台站得到的远震SKS(SKKS)波分裂结果和已发表的固定台站结果的分析,表明研究区按照各向异性特征可分为华北东部和西部两个区.华北东部各向异性快波方向基本为NWW-SEE 方向,而西部的快波方向转到NW-SE 或NNW-SSE.华北西部的平均快、慢波时间延迟为0.79s, 小于华北东部的平均值0.97s.在华北东部,快波方向与APM 方向基本一致,预示了NWW 向的软流圈地幔流是引起该区域上地幔各向异性的主要原因,它使得上地幔橄榄岩等晶体的晶格优势取向沿地幔物质流动方向,从而导致了NWW 趋向的快波方向.华北东部的中部带与东部陆块的各向异性特征相同,支持了中部带在中生代和新生带也经历了岩石圈的活化过程,岩石圈遭到了破坏.然而,在稳定的西部,快波方向既不与绝对板块运动方向一致,也不与构造走向一致,这种弱各向异性很可能是遗留在古老克拉通的厚的岩石圈内的“化石"各向异性的表现.
致谢所有参与中国地震局地球物理研究所华北地震科学探测台阵项目的规划者和实施者为确保获取高质量的地震数据付出了努力.P.G.Silver, L.M.Flesch和许忠淮在方法和解释上给予了帮助.两位匿名审稿人提出了宝贵的修改意见,在此一并感谢.
| [1] | Pearson D G. The age of continental roots. Lithos , 1999, 48(1-4): 171-194. DOI:10.1016/S0024-4937(99)00026-2 |
| [2] | Zhao G C, Wilde S A, Cawood P A, et al. Archean blocks and their boundaries in the North China Craton: lithological, geochemical, structural and P-T path constraints and tectonic evolution. Precambr. Res. , 2001, 107(1-2): 45-73. DOI:10.1016/S0301-9268(00)00154-6 |
| [3] | Griffin W L, Zhang A D, O'Reilly S Y, et al. Phanerozoic evolution of the lithosphere beneath the Sino-Korean craton.//Flower M, Chung S L, Lee T Y,eds. Mantle Dynamics and Plate Interactions in East Asia. Washington DC: American Geophysics Union, Geodynamic Series, 1998, 27: 107-126. |
| [4] | Menzies M A, Fan W M, Zhang M. Palaeozoic and Cenozoic lithoprobes and the loss of >120 km of Archaean lithosphere, Sino-Korean craton, China.//Prichard H M,ed. Magmatic Processes and Plate Tectonics. Geol. Soc. Spel. Pub, 1993, 76: 71-78. |
| [5] | Zheng J P, O'Reill S Y, Griffin W L, et al. Relict refractory mantle beneath the eastern North China block: significance for lithosphere evolution. Lithos , 2001, 57(1): 43-66. DOI:10.1016/S0024-4937(00)00073-6 |
| [6] | Xu Y G. Diachronous lithospheric thinning of the North China Craton and formation of the Daxin'anling-Taihangshan gravity lineament. Lithos , 2007, 96(1-2): 281-298. DOI:10.1016/j.lithos.2006.09.013 |
| [7] | Deng J F, Mo X X, Zhao H L, et al. Lithosphere root/de-rooting and activation of the East China continent. Geoscience , 1994, 8(3): 349-356. |
| [8] | Deng J F, Mo X X, Zhao H L, et al. A new model for the dynamic evolution of Chinese lithosphere: 'continental roots-plume tectonics’. Earth Sci. Rev. , 2004, 65(3-4): 223-275. DOI:10.1016/j.earscirev.2003.08.001 |
| [9] | Zhou X H, Sun M, Zhang G H, et al. Continental crust and lithospheric mantle interaction beneath North China: isotopic evidence from granulite xenoliths in Hannuoba, Sino-Korean craton. Lithos , 2002, 62(3-4): 111-124. DOI:10.1016/S0024-4937(02)00110-X |
| [10] | Gao S, Rudnick R L, Yuan H L, et al. Recycling lower continental crust in the North China craton. Nature , 2004, 432(7019): 892-897. DOI:10.1038/nature03162 |
| [11] | Xu Y G. Diachronous lithospheric thinning of the North China Craton and formation of the Daxin'anling-Taihangshan gravity lineament. Lithos , 2007, 96(1-2): 281-298. DOI:10.1016/j.lithos.2006.09.013 |
| [12] | 邱瑞照, 邓晋福, 周肃, 等. 华北地区岩石圈类型: 地质与地球物理证据. 中国科学D辑: 地球科学 , 2005, 48(11): 1809–1827. Qiu R Z, Deng J F, Zhou S, et al. Lithosphere types in North China: evidence from geology and geophysics. Science in China (Series D): Earth Sciences (in Chinese) , 2005, 48(11): 1809-1827. DOI:10.1360/03yd0380 |
| [13] | 朱日祥, 陈凌, 吴福元, 等. 华北克拉通破坏的时间、范围与机制. 中国科学D辑: 地球科学 , 2011, 54(6): 789–797. Zhu R X, Chen L, Wu F Y, et al. Timing, scale and mechanism of the destruction of the North China Craton. Science in China (Series D): Earth Sciences (in Chinese) , 2011, 54(6): 789-797. DOI:10.1007/s11430-011-4203-4 |
| [14] | Hess H H. Seismic anisotropy of the uppermost mantle under oceans. Nature , 1964, 203(4945): 629-631. DOI:10.1038/203629a0 |
| [15] | Nicolas A, Christensen N I. Formation of anisotropy in upper mantle peridotites: A review. Geodyn. Ser. , 1987, 16: 111-123. DOI:10.1029/GD016 |
| [16] | Savage M K. Seismic anisotropy and mantle deformation: What have we learned from shear wave splitting?. Rev. Geophys. , 1999, 37(1): 65-106. DOI:10.1029/98RG02075 |
| [17] | Zhao L, Zheng T Y. Using shear wave splitting measurements to investigate the upper mantle anisotropy beneath the North China Craton: distinct variation from east to west. Geophysical Research Letters , 2005, 32: L10309. DOI:10.1029/2005GL022585 |
| [18] | Zhao L, Zheng T Y, Lü G. Insight into craton evolution: Constraints from shear wave splitting in the North China Craton. Phys. Earth Planet. Int. , 2008, 168(3-4): 153-162. DOI:10.1016/j.pepi.2008.06.003 |
| [19] | 常利军, 王椿镛, 丁志峰. 首都圈地区SKS波分裂研究. 地震学报 , 2008, 30(6): 551–559. Chang L J, Wang C Y, Ding Z F. A study on SKS splitting beneath Capital area of China. Acta Seismologica Sinica (in Chinese) , 2008, 30(6): 551-559. |
| [20] | 常利军, 王椿镛, 丁志峰. 中国东部上地幔各向异性研究. 中国科学D辑: 地球科学 , 2009, 52(6): 774–783. Chang L J, Wang C Y, Ding Z F. Seismic anisotropy of upper mantle in eastern China. Science in China (Series D): Earth Sciences (in Chinese) , 2009, 52(6): 774-783. DOI:10.1007/s11430-009-0073-4 |
| [21] | 常利军, 王椿镛, 丁志峰. 鄂尔多斯块体及周缘上地幔各向异性研究. 中国科学D辑: 地球科学 , 2011, 54(6): 888–900. Chang L J, Wang C Y, Ding Z F. Upper mantle anisotropy in the Ordos block and its margins. Science in China (Series D): Earth Sciences (in Chinese) , 2011, 54(6): 888-900. DOI:10.1007/s11430-010-4137-2 |
| [22] | Huang Z C, Wang L X, Zhao D P, et al. Seismic anisotropy and mantle dynamics beneath China. Earth Plane. Sci. Lett. , 2011, 306(1-2): 105-117. DOI:10.1016/j.epsl.2011.03.038 |
| [23] | Li J, Niu F L. Seismic anisotropy and mantle flow beneath northeast China inferred from regional seismic networks. J. Geophys. Res. , 2010, 115: B12327. DOI:10.1029/2010JB007470 |
| [24] | Liu K H, Gao S S, Gao Y, et al. Shear wave splitting and mantle flow associated with the deflected Pacific slab beneath northeast Asia. J. Geophys. Res. , 2008, 113: B01305. DOI:10.1029/2007JB005178 |
| [25] | Tian X B, Zhang J L, Si S K, et al. SKS splitting measurements with horizontal component misalignment. Geophys. J. Int. , 2011, 185(1): 329-340. DOI:10.1111/gji.2011.185.issue-1 |
| [26] | Silver P G, Chan W W. Shear wave splitting and subcontinental mantle deformation. J. Geophys. Res. , 1991, 96(B10): 16429-16454. DOI:10.1029/91JB00899 |
| [27] | Wolfe C J, Silver P G. Seismic anisotropy of oceanic upper mantle: Shear wave splitting methodologies and observations. J. Geophys. Res. , 1998, 103(B1): 749-771. DOI:10.1029/97JB02023 |
| [28] | Vinnik L P, Farra V, Romanowicz B. Azimuthal anisotropy in the Earth from observations of SKS at Geoscope and NARS broadband stations. Bull. Sesimol. Soc. Amer. , 1989, 79(5): 1542-1558. |
| [29] | 王椿镛, 常利军, 吕智勇, 等. 青藏高原东部上地幔各向异性及相关的壳幔耦合型式. 中国科学D辑: 地球科学 , 2007, 50(8): 1150–1160. Wang C Y, Chang L J, Lü Z Y, et al. Seismic anisotropy of upper mantle in eastern Tibetan Plateau and related crust-mantle coupling pattern. Science in China (Series D): Earth Sciences (in Chinese) , 2007, 50(8): 1150-1160. DOI:10.1007/s11430-007-0053-5 |
| [30] | Long M D, Silver P G. The subduction zone flow field from seismic anisotropy: a global view. Science , 2008, 319(5861): 315-318. DOI:10.1126/science.1150809 |
| [31] | Silver P G. Seismic anisotropy beneath the continents: probing the depths of geology. Annu. Rev. Earth Planet. Sci. , 1996, 24(1): 385-432. DOI:10.1146/annurev.earth.24.1.385 |
| [32] | Vinnik L P, Makeyeva L I, Milev A, et al. Global patterns of azimuthal anisotropy and deformations in the continental mantle. Geophys. J. Int. , 1992, 111(3): 433-447. DOI:10.1111/gji.1992.111.issue-3 |
| [33] | Gripp A E, Gordon R G. Young tracks of hotspots and current plate velocities. Geophys. J. Int. , 2002, 150(2): 321-361. DOI:10.1046/j.1365-246X.2002.01627.x |
| [34] | Li S L, Mooney W D, Fan J C. Crustal structure of mainland China from deep seismic sounding data. Tectonophysics , 2006, 420(1-2): 239-252. DOI:10.1016/j.tecto.2006.01.026 |
| [35] | 嘉世旭, 张先康. 华北不同构造块体地壳结构及其对比研究. 地球物理学报 , 2005, 48(3): 611–620. Jia S X, Zhang X K. Crustal structure and comparison of different tectonic blocks in North China. Chinese J. Geophys. (in Chinese) , 2005, 48(3): 611-620. DOI:10.1002/cjg2.694 |
| [36] | 吴晶, 高原, 陈运泰. 首都圈东南部地区地壳介质各向异性. 地震学报 , 2008, 21(1): 1–10. Wu J, Gao Y, Chen Y T. Crustal seismic anisotropy in Southeastern Capital area, China. Acta Seismologica Sinica (in Chinese) , 2008, 21(1): 1-10. DOI:10.1007/s11589-008-0001-2 |
| [37] | Huang Z X, Su W, Peng Y J, et al. Rayleigh wave tomography of China and adjacent regions. J. Geophys. Res. , 2003, 108(B2): 2073. DOI:10.1029/2001JB001696 |
| [38] | Chen L, Zheng T Y, Xu W W. A thinned lithospheric image of the Tanlu Fault Zone, eastern China: constructed from wave equation based receiver function migration. J. Geophys. Res. , 2006, 111: B09312. DOI:10.1029/2005JB003974 |
| [39] | 彭艳菊, 黄忠贤, 苏伟, 等. 中国大陆及邻区海域地壳上地幔各向异性研究. 地球物理学报 , 2007, 50(3): 752–759. Peng Y J, Huang Z X, Su W, et al. Anisotropy in crust and upper mantle beneath China continent and its adjacent seas. Chinese J. Geophys. (in Chinese) , 2007, 50(3): 752-759. |
| [40] | Li Y H, Wu Q J, Zhang R Q, et al. The lithospheric thinning of the North China Craton inferred from Rayleigh waves inversion. Geophys. J. Int. , 2009, 177(3): 1334-1342. DOI:10.1111/gji.2009.177.issue-3 |
| [41] | Chen L, Tao W, Zhao L, et al. Distinct lateral variation of lithospheric thickness in the Northeastern North China Craton. Earth Planet. Sci. Lett. , 2008, 267(1-2): 56-68. DOI:10.1016/j.epsl.2007.11.024 |
| [42] | Sodoudi F, Yuan X H, Liu Q Y, et al. Lithospheric thickness beneath the Dabie Shan, central eastern China from S receiver functions. Geophys. J. Int. , 2006, 166(3): 1363-1367. DOI:10.1111/gji.2006.166.issue-3 |
| [43] | Fan W M, Zhang H F, Baker J, et al. On and off the North China Craton: where is the Archaean keel?. J. Petrol. , 2000, 41(7): 933-950. DOI:10.1093/petrology/41.7.933 |
| [44] | Shi L B, Lin C Y, Chen X D, et al. A xenolith-derived geotherm for the lower crust and upper mantle beneath Hanuoba area, Hebei Province, China and its geologic implications. Seismol. Geol. , 2000, 22(1): 37-46. |
| [45] | An M J, Shi Y L. Lithospheric thickness of the Chinese continent. Phys. Earth Planet. Ints. , 2006, 159(3-4): 257-266. DOI:10.1016/j.pepi.2006.08.002 |
| [46] | Huang J L, Zhao D P. High-resolution mantle tomography of China and surrounding regions. J. Geophys. Res. , 2006, 111: B09305. DOI:10.1029/2005JB004066 |