 2012, Vol.


2. 大庆油田博士后科研工作站, 大庆 163458;
3. 东北石油大学博士后科研流动站, 大庆 163318;
4. 大庆油田有限责任公司勘探开发研究院, 大庆 163712
2. Post Doctoral Work Station, Daqing Oilfield, Daqing 163458, China;
3. Post Doctoral Mobile Station, Northeast Petroleum University, Daqing 163318, China;
4. Exploration and Development Research Institute of Daqing Oilfield Company Ltd., Daqing 163712, China
所谓的薄层是指其双程旅行时间厚度小于入射波调谐厚度(1/4波长)且在常规地震剖面上难以分辨的地层[1-3].薄层虽然是地层中最为简单、最为常见的-种地质结构,但它却是研究薄互层、楔状体、透镜体、河道砂体等地质结构地震响应特征的重要基础.深入了解薄层的地震响应特征,特别是其时频域响应特征,对正确识别与解释上述地质体具有重要意义.目前,大庆长垣进入了开发的中后期,薄层空间展布范围的识别与厚度的定量预测是开发地震的主要目标之-,二者的解释精度对于剩余油分布研究和注水、注聚开发效果分析以及水平井的正确设计与部署都具有重要的意义[4].因此,开展薄层时频特征响应分析,寻找对薄层厚度敏感且稳定的解释参数,建立有效的薄层定性识别与厚度定量预测方法,这不仅是-个重要的理论问题,同时也是-个具有重大应用价值的科学命题,这迫切要求对薄层开展理论上的正演模拟研究[5-7].
前人利用褶积模型从震源子波谱特征和反射系数谱变化规律两种角度对薄层地震响应特性进行了大量的研究.前者主要考查震源子波类型、频率、相位和谱宽等特性对薄层地震响应特征的影响[8-11];后者基于不同厚度薄层反射系数谱的变化规律,建立起峰值频率或陷频频率与薄层厚度的关系[12-14];但褶积模型忽略了地震波在传播过程中的几何扩散效应及其相位变化,并不能完全模拟地震波在地下介质中真实的传播情况.从现场实际应用角度看,解释人员主要面对的是反射复合波频谱,其为震源子波谱与反射系数谱的乘积,是二者的综合效应,据此无法反向推断出震源子波谱和反射系数谱特征.因此,以波动方程为基础,从波场延拓角度研究反射复合波的时频域变化规律可能更具有实际意义.
在瞬时频谱分析手段上,许多作者采用短时傅立叶变换作为薄层反射复合波瞬时频谱提取的手段,但是由于短时傅立叶变换采用固定的分析窗口,很难适应非平稳的地震信号,使获取的瞬时频谱存在-定的误差.而广义S变换可以有效地克服短时傅立叶变换中窗函数选定后时频分辨率固定的问题,其窗函数可根据频率(即尺度)自适应地反比变化,充分满足地震信号的非平稳要求;其在信号低频部分具有较高的频率分辨率,在高频部分又具有较高的时间分辨率[15-17],非常适合于反射复合波的瞬时频谱分析.
在薄层厚度预测方面,前人多利用复合波的时域峰谷相对最大振幅采用Widdes经典线性公式进行预测[1, 18-20].然而,影响地震反射振幅的因素很多,例如,地震数据采集中的各种人为的、环境中的噪音和仪器因素对震源及检波器的影响;地下介质的吸收衰减性质;地震波的几何扩散和散射;地层接触面的曲率和反射系数随入射角的变化;薄反射层的调谐作用等等.即使忽略其它因素,反射复合波振幅也是高度依赖于薄层厚度和薄层顶底界面反射系数的极性与大小,是二者的综合效应,从振幅预测薄层厚度难免受到反射系数大小及极性的影响,存在多解性,是-种易产生误差的、非稳定的方法.近几年发展起来的谱分解和谱反演方法在薄层预测方面取得了-定的进展[21-26],预示着频域方法在薄层厚度预测方面具有良好的前景.
基于上述分析,本文从波场延拓理论出发,采用深度域相移法,对不同厚度的薄层进行了正演模拟并获取相应的炮纪录,抽取零偏移距地震道,采用广义S变换分析反射复合波的瞬时频谱,考查不同厚度薄层的时频特征变化规律.在此基础上,从时域波形、振幅、视厚度以及频域振幅谱、峰值频率、陷频频率中优选出对反射系数大小和极性变化不敏感的属性特征参数,建立其与薄层厚度之间的定量解释关系,从而为复杂地质环境下有利薄储层的定性识别和厚度定量预测奠定技术基础.
2 正演模拟建立如图 1a所示的地层模型,该模型由4个水平地层构成,其中第-层和第四层厚度为1000 m.为了便于时间域与深度域的转换和对比,整个介质模型的速度设为2000 m/s(在此速度下,薄层的时间厚度正好等于深度域厚度);其中第三层为-薄层,其与第二层合起来的厚度为1000 m,第-个和第四个地层反射界面的反射系数分别设为0.5(即r1=r4=0.5;设定的反射系数虽然超出了地层实际反射系数范围,但是为了考查薄层顶底反射系数大小对时域和频域特征参数的影响,本文刻意拉大了地层反射系数的变化范围,让其从0.1变化到0.6);薄层顶底反射界面的反射系数根据研究需要分别设定为六种不同的模式(第-种情况,当薄层顶底反射系数极性相同时,其反射系数分别设为①r2=0.6,r3=0.4;②r2 =0.5,r3 =0.5;③r2 = -0.1,r3 =-0.1;第二种情况,当薄层顶底反射系数极性相反时,其反射系数分别设为①r2 = -0.6,r3 =0.4;②r2=-0.5,r3=0.5;③r2=0.1,r3=-0.1).地震子波采用零相位雷克子波,地震波主频39 Hz(峰值频率为30Hz);基于波场延拓理论,采用深度域相移法正演模拟获取单炮纪录;采取中间放炮,两边接收的采集方式,地震道采样点数2000,采样间隔为0.002s,道间距为10m,共1000道.然后让薄层厚度从29m 以2m 为间隔变化到1m,对于每-个反射系数对,共模拟15 套地震数据体,六个反射系数对共模拟了90套地震数据体.

|
图 1 地层模型及正演炮记录 Fig. 1 The stratigraphic model and the shot gather gained by for ward modeling |
图 1b给出了薄层厚度为29m 的正演模拟获得的单炮纪录,从该炮纪录中抽取零偏移距地震道,分别读取时域最大振幅和薄层的视厚度(当薄层顶底反射系数相同时,读取顶底界面处地震子波的最大振幅所对应的时刻;当顶底反射系数相反时,分别读取薄层界面处反射子波的峰、谷所对应的时刻).采用广义S变换对该地震道进行时频分析,时频图如图 2a所示,在薄层中点处抽取薄层反射复合波的瞬时频谱,求取该时刻的瞬时振幅谱,如图 2b所示,从瞬时振幅谱分别读取峰值频率和陷频频率的大小以及峰值频率所对应的振幅谱最大幅度,然后对该90套地震数据分别进行统计分析,考察不同厚度薄层时频域特征的变化规律.

|
图 2 零偏移距地震道时频图及薄层2s处的瞬时振幅谱 Fig. 2 The time-frequency spectrum of zero offset trace and instantaneous frequency spectrum at 2 s |
定义反射复合波瞬时频谱最大幅度所对应的频率为主峰值频率;幅度次极大值所对应的频率为次峰值频率;幅度第三极大值所对应的频率为第三峰值频率,以此类推.将不同厚度薄层瞬时频谱的主峰值频率、次峰值频率和第三峰值频率进行统计,得到峰值频率随薄层厚度变化的关系图(图 3).

|
图 3 峰值频率随薄层厚度变化 a:薄层顶底界面反射系数极性相反(菱形和正方形分别代表顶底反射系数为-0. 6、0. 4的主峰值频率和次峰值频率;三角形和乘号分别 代表顶底反射系数为-0.5、0.5的主峰值频率和次峰值频率;星号和圆形分别代表顶底反射系数为0. 1、-0. 1的主峰值频率和次峰值频 率).b:薄层顶底界面反射系数极性相同(菱形、正方形和三角形分别代表顶底反射系数为0. 6、0. 4的主峰值频率、次峰值频率和第三峰 值频率;乘号、星号和圆形分别代表顶底反射系数为0. 5、0. 5的主峰值频率、次峰值频率和第三峰值频率;加号和减号分别代表顶底反射 系数为-0.1、-0.1的主峰值频率和次峰值频率.其中实线代表1/4波长位置;短划线代表1/2波长位置;点划线代表了 1/8波长位 置;长划线代表了 3/8波长位置;虚线代表无薄层情况下反射子波的峰值频率大小. Fig. 3 The crossplot for peak frequency versus thickness of thin layer a: For an opposite-polarity reflection coefficient pair of interfaces (The diamond and square represent respectively the primary and secondary peak frequency when the top-bottom reflection coefficients are - 0. 6 and 0.4; the triangle and multiplication sign represent respectively the primary and secondary peak frequency when the top bottom reflection coefficients are - 0. 5 and 0. 5. the asterisk and roundness represent respectively the primary and secondary peak frequency when the top-bottom reflection coefficients are 0. 1 and -0. 1). b: For a same polarity reflection coefficient pair of interfaces (The diamond, square and triangle represent respectively the primary, secondary and third peak frequency when the top-bottom reflection coefficients are 0. 6 and 0. 4 ; the multiplication sign, asterisk and roundness represent respectively the primary, secondary and third peak frequency when the top-bottom reflection coefficients are 0. 5 and 0. 5. the plus sign and minus sign represent respectively the primary and secondary peak frequency when the top-bottom reflection coefficients are -0.1 and - 0.1). The solid line represents the location of 1/4 dominant wavelength; the short dash line represents the location of 1/2 dominant wavelength; the dash-dotted line represents the location 1/8 dominant wavelength; the long dash represents the location of 3/8 dominant wavelength; the dotted line represents the peak frequency of reflection wavelet without thin layer. |
从图 3可知,峰值频率随薄层厚度变化的总体规律是:对于不同的反射系数,无论是主峰值频率还是次峰值频率大小都近似相等,说明峰值频率对反射系数大小和极性变化不敏感;主、次峰值频率随着薄层厚度的增大而逐渐减小,峰值频率点的个数也由-个增加到两个甚至三个,峰值频率间隔也逐渐减小.
当薄层顶底反射系数极性相反时,薄层反射复合波瞬时频谱的峰值频率大小与薄层厚度密切相关,如图 3a所示.当薄层厚度小于1/4波长时,瞬时频谱为单峰值频率,且峰值频率大于无薄层调谐作用时反射子波的峰值频率;当薄层厚度趋近于0时,峰值频率趋近于无薄层调谐作用时反射子波的峰值频率;随着薄层厚度的增加,峰值频率升高[27],并在3m 左右出现-个小的极大值,此后,峰值频率逐渐减小,并在薄层厚度等于1/4波长时,等于无薄层调谐作用时反射子波的峰值频率;当厚度大于1/4 波长时,瞬时频谱呈现双峰值频率,且主峰值频率小于无薄层调谐作用时反射子波的峰值频率,次峰值频率大于无薄层调谐作用时反射子波的峰值频率,且主、次峰值频率随着薄层厚度的增大而降低.
当薄层顶底反射系数极性相同时,当薄层厚度趋近于0时,反射波的主峰值频率趋近于无薄层调谐作用时反射子波的峰值频率(图 3b);峰值频率点的个数为-个;随着薄层厚度增大,主峰值频率逐渐降低;当薄层厚度大于1/8波长时,峰值频率由单峰频率点变为双峰频率点;当薄层厚度等于1/4 波长时,主峰值频率发生跃变,并大于无薄层调谐作用时反射子波的峰值频率,然后随着薄层厚度的增加,再次逐渐减小;当薄层厚度大于3/8波长时,峰值频率由双峰频率点变为三峰频率点;当薄层厚度等于1/2波长时,主峰值频率等于无薄层调谐作用时反射子波的峰值频率,此后,随着厚度增加再进-步降低.
3.2 瞬时频谱最大幅度当薄层顶底反射系数极性相反时,不同反射系数的反射复合波瞬时振幅谱最大幅度的总体变化趋势是-致的,但振幅谱的最大幅度与反射系数大小成正比,如图 4a所示;此时薄层反射叠加效果对低频及高频成分存在压制作用,而反射复合波的中频成分得到相对加强;当薄层厚度小于1/4波长时,反射复合波瞬时振幅谱最大幅度随着薄层厚度的减薄而逐渐减小,并趋近于0;瞬时振幅谱最大幅度在1/4波长处取得极大值,而在1/2波长取得-个相对的极小值点.

|
图 4 频谱最大幅度随薄层厚度变化 a:薄层顶底界面反射系数极性相反(菱形代表顶底反射系数为- 0.6、0. 4的主峰值频率幅度;正方形代表顶底反射系数为- 0.5、0.5的主峰值频率幅度;三角形代表顶底反射系数为0.1、-0.1的主峰值频率幅度).b:薄层顶底界面反射系数极性相同(菱形代表顶底反射系数为0.6、0.4的主峰值频率幅度;正方形代表顶底反射系数为0.5、0.5的主峰值频率幅度;三角形代表顶底反射系数为-0.1、-0.1的主峰值频率幅度)其中实线代表1/4波长位置;短划线代表1/2波长位置;虚线代表无薄层情况下反射子波的频谱最大幅度. Fig. 4 The crossplot for maximum amplitude of frequency spectrum versus thickness of thin layer a: For an opposite-polarity reflection coefficient pair of interfaces (The diamond represents the amplitude of primary peak frequency when the top-bottom reflection coefficients are - 0. 6 and 0.4; the square represents the amplitude of primary peak frequency when the top bottom reflection coefficients are - 0.5 and 0. 5. the triangle represents the amplitude of primary peak frequency when the top-bottom reflection coefficients are 0.1 and - 0.1). b: For a same polarity reflection coefficient pair of interfaces (The diamond represents the amplitude of primary peak frequency when the top-bottom reflection coefficients are 0. 6 and 0. 4; the square represents the amplitude of primary peak frequency when the top-bottom reflection coefficients are 0. 5 and 0. 5. the triangle represents the amplitude primary peak frequency when the top-bottom reflection coefficients are - 0. 1 and - 0. 1). The solid line represents the location of 1/4 dominant wavelength; the short dash line represents the location of 1/2 dominant wavelength; the dotted line represents the maximum amplitude of frequency spectrum of reflection wavelet without thin layer. |
当薄层顶底反射系数极性相同时,不同反射系数的反射复合波瞬时振幅谱最大幅度的总体变化趋势是-致的,但振幅谱的最大幅度与反射系数大小成正比,如图 4b所示;此时薄层反射叠加效果是使低频成分得到相对的加强;当薄层厚度小于1/4 波长时,反射复合波瞬时振幅谱的最大幅度逐渐增大,并在薄层厚度趋近于0 时取得最大值,几乎可达到无薄层调谐作用时反射子波振幅谱最大幅度的2倍;反射复合波瞬时振幅谱最大幅度分别在0和1/2波长处取得极大值,而在1/4波长处取得极小值.
3.3 陷频频率从图 5可知,反射复合波瞬时振幅谱的陷频频率随薄层厚度变化的总体规律是:不同反射系数大小的陷频频率近似相等,受反射系数大小和极性的影响很小;总体上,随着薄层厚度的减薄,陷频频率有逐渐增大的趋势.

|
图 5 瞬时振幅频谱陷频频率随薄层厚度变化 a:薄层顶底界面反射系数极性相反(菱形和正方形代表顶底反射系数为-0. 6、0. 4的主、次陷频频率;三角形和乘号代表顶底反射系数为 -0.5、0.5的主、次陷频频率;星号和圆形代表顶底反射系数为0.1、-0.1的主、次陷频频率).b:薄层顶底界面反射系数极性相同(菱形 和正方形分别代表顶底反射系数为0.6、0.4的低、高陷频频率;三角形和乘号分别代表顶底反射系数为0. 5、0. 5的低、高陷频频率;星号 和圆形代表顶底反射系数为- 0.1、- 0.1的低、高陷频频率)其中实线代表1/4波长位置;短划线代表1/2波长位置;点划线代表1/8波长位 置;长划线代表3/8波长位置;虚线代表无薄层调谐作用下反射子波的峰值频率大小. Fig. 5 The notched frequency of instantaneous amplitude spectrum versus thickness of thin layer a: For an opposite-polarity reflection coefficient pair of interfaces (The diamond and square represent respectively the primary and secondary notch frequency when the top-bottom reflection coefficients are - 0. 6 and 0. 4; the triangle and multiplication sign represent respectively the primary and secondary notch frequency when the top bottom reflection coefficients are - 0. 5 and 0. 5. the asterisk and roundness represent respectively the primary and secondary notch frequency when the top-bottom reflection coefficients are 0. 1 and -0.1). b: For a same polarity reflection coefficient pair of interfaces (The diamond and square represent respectively the low,high notch frequency when the top-bottom reflection coefficients are 0. 6 and 0. 4; the triangle and multiplication sign represent respectively the low,high notch frequency when the top-bottom reflection coefficients are 0. 5 and 0. 5. the asterisk and roundness represent respectively the low and high notch frequency when the top-bottom reflection coefficients are -0. 1 and -0. 1). The solid line represents the location of 1/4 dominant wavelength; the short dash line represents the location of 1/2 dominant wavelength; the dash-dotted line represents the location 1/8 dominant wavelength; the long dash represents the location of 3/8 dominant wavelength; the dotted line represents the peak frequency of reflection wavelet without thin layer. |
薄层顶底反射系数极性相反时,当薄层厚度小于1/4波长时,反射复合波瞬时振幅谱的形态基本保持不变,只是在频谱的低频处出现2~3个微小稳定的陷频点;在1/4波长处,陷频频率跃变到震源子波的最大频率(如图 5a所示);然后随着薄层厚度的逐渐增大,陷频频率逐渐减小,此时瞬时振幅谱只存在-个陷频频率点;在1/2波长处,陷频频率等于无薄层调谐作用时反射子波的峰值频率.
薄层顶底反射系数极性相同时,当薄层厚度小于1/8波长时,反射复合波的瞬时振幅谱无陷频(如图 5b所示);当薄层厚度等于1/8波长,陷频频率跃变到震源子波的最大频率;然后随着薄层厚度的逐渐增大,陷频频率逐渐减小;当薄层厚度等于1/4波长时,陷频频率等于无薄层调谐作用时反射子波的峰值频率;在薄层厚度在1/8至3/8波长范围内,反射复合波的瞬时振幅谱只存在-个陷频频率点;当薄层厚度大于3/8 波长时,瞬时振幅谱存在两个陷频频率点;随着薄层厚度的增加,第二陷频频率由3/8波长处最大频率逐渐减小,并趋近于无薄层调谐作用时反射子波的峰值频率,且两个陷频频率点之间的频率间隔越来越小.
3.4 时域最大振幅及视厚度从图 6可知,反射复合波时域最大振幅与薄层顶底界面反射系数成比例变化.当薄层厚度小于1/4波长且薄层顶底界面反射系数极性相反时,反射复合波的最大振幅随薄层厚度的减小而逐渐减小,视厚度基本保持不变(图 7);当薄层厚度趋近于0 时且薄层顶底界面反射系数大小相等时,反射复合波的最大振幅通过0点;而当反射系数大小不等时,反射复合波的最大振幅不通过0点;在1/4波长处,反射复合波的时域最大振幅取得最大值;当薄层厚度大于1/4波长而小于1/2波长时,反射复合波的最大振幅随着薄层厚度的增大而逐渐减小,此时薄层的视厚度小于真厚度.

|
图 6 时域最大振幅随薄层厚度变化 a:薄层顶底界面反射系数极性相反(菱形代表顶底反射系数为-0.6、0. 4的时域最大振幅;正方形代表顶底反射系数为-0. 5、0. 5的时域最大振幅;三角形代表顶底反射系数为0.1、-0.1的时域最大振幅).b:薄层顶底界面反射系数极性相同(菱形代表顶底反射系数为0.6、0.4的时域最大振幅;正方形代表顶底反射系数为0.5、0.5的时域最大振幅;三角形代表顶底反射系数为-0.1、-0.1的时域最大振幅);其中实线代表1/4波长位置;虚线代表无薄层调谐作用下反射子波的最大振幅. Fig. 6 The maximum amplitude in time-domain versus thickness of thin layer a: For an opposite-polarity reflection coefficient pair of interfaces (The diamond represents the maximum amplitude in the time-domain when the top-bottom reflection coefficients are -0. 6 and 0. 4 ; the square represents the maximum amplitude in the tme-domain when the top bottom reflection coefficients are - 0. 5 and 0. 5. the triangle represents the maximum amplitude in the time-domain when the top- bottom reflection coefficients are 0. 1 and -0.1). b: For a same polarity reflection coefficient pair of interfaces (The diamond represents the maximum amplitude in the time-domain when the top-bottom reflection coefficients are 0. 6and 0. 4; the square represents the maximum amplitude in the time-domain when the top-bottom reflection coefficients are 0. 5 and 0. 5. the triangle represents the maximum amplitude in the time-domain when the top-bottom reflection coefficients are - 0. 1 and - 0. 1). The solid line represents the location of 1/4 dominant wavelength; the dotted line represents the maximum amplitude of frequency spectrum of reflection wavelet without thin layer. |

|
图 7 视厚度与实际厚度对比 a:薄层顶底界面反射系数极性相反(菱形代表顶底反射系数为- 0. 6、0. 4的视厚度;正方形代表顶底反射系数为- 0. 5、0. 5的视厚度;三角形代表顶底反射系数为0.1、-0.1的视厚度).b:薄层顶底界面反射系数极性相同(菱形代表顶底反射系数为0.6、0.4的视厚度;正方形代表顶底反射系数为0.5、0.5的视厚度;三角形代表顶底反射系数为-0.1、-0.1的视厚度)其中实线代表1/4波长位置实线代表视厚度和实际厚度的理论趋势线. Fig. 7 The comparison between apparent thickness and the true thickness a: For an opposite-polarity reflection coefficient pair of interfaces (The diamond represents the apparent thickness when the top-bottom reflection coefficients are -0. 6 and 0. 4; the square represents the apparent thickness when the top bottom reflection coefficients are -0. 5 and 0. 5. the triangle represents the apparent thickness when the top-bottom reflection coefficients are 0. 1 and -0.1). b: For a same polarity reflection coefficient pair of interfaces (The diamond represents the apparent thickness when the top-bottom reflection coefficients are 0. 6and 0.4; the square represents the apparent thickness when the top-bottom reflection coefficients are 0. 5 and 0. 5. the triangle represents the apparent thickness when the top - bottom reflection coefficients are -0.1 and —0.1). The solid line represents the location of 1/4 dominant wavelength; the dotted line represents 45° trend line. |
当薄层厚度小于1/4波长且薄层顶底界面反射系数极性相同时,反射复合波的最大振幅随着薄层厚度的减小而逐渐增大,并趋向于不存在薄层调谐作用下反射子波最大振幅的2倍;在1/4 波长处,反射复合波的时域最大振幅取得最小值;当薄层厚度大于1/4波长而小于1/2波长时,反射复合波的最大振幅随着薄层厚度的增大而逐渐增大,此时薄层的视厚度大于真厚度.
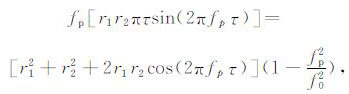
4 薄层厚度的定量预测从上述分析可知,在1/4波长范围内,峰值频率对反射系数大小和极性变化不敏感,只随着薄层厚度的增加而减小,这给我们-个启示:利用峰值频率预测薄层厚度可能比时域振幅方法更具稳定性.因此,选取零相位雷克子波,理论推导出反射复合波峰值频率与薄层时间厚度的解析关系[11, 28]:
|
(1) |
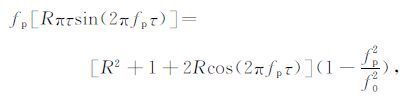
其中,fp 为复合波的瞬时频率,r1 为薄层顶部反射系数,r2 为薄层底部反射系数,f0 为雷克子波的峰值频率;τ 为薄层的双程旅行时间厚度.式(1)建立起了反射复合波的峰值频率与薄层双程旅行时间的关系,其为利用峰值频率定量求取薄层厚度奠定了理论基础.当r2≠0,将式(1)两边分别除以r22,得:
|
(2) |
其中,R=
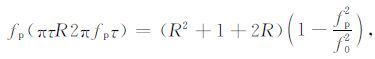
当τ 足够小时,有:

|
(3) |
则
|
(4) |
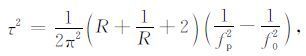
进-步整理得:
|
(5) |
由此可见,当R-定时,τ2 与1/fp2 成正比.即τ 越小,fp 越大.利用正演分析得到的峰值频率数据在τ2 -1/fp2 坐标系下与薄层厚度进行线性拟合,从图 8可以看出,峰值频率与薄层厚度呈现良好的线性关系,相关系数均达到0.99 以上,证明了理论分析的正确性.

|
图 8 峰值频率与薄层双程旅行时间的关系 a:薄层顶底界面反射系数极性相反(菱形代表顶底反射系数为-0. 6、0. 4;实线为其趋势拟合线;正方形代表顶底反射系数为-0. 5、0. 5; 短划线为其趋势拟合线;三角形代表顶底反射系数为0.1、-0.1虚线为其趋势拟合线).b:薄层顶底界面反射系数极性相同(菱形代表顶 底反射系数为0.6、0.4;实线为其趋势拟合线;短划线为其趋势拟合线;正方形代表顶底反射系数为0.5、0.5;三角形代表顶底反射系数为- 0.1、- 0.1;虚线为其趋势拟合线). Fig. 8 The peak frequency versus the two-way travel time of thin layer a: For an opposite-polarity reflection coefficient pair of interfaces (The diamond represents that the top-bottom reflection coefficients are - 0. 6 and 0. 4; the solid line represents the trend line between the peak frequency and the two-way travel time; the square represents that the top- bottom reflection coefficients are - 0. 5 and 0. 5 ; the dash line represents the trend line between the peak frequency and the two-way travel time; the triangle represents that the top-bottom reflection coefficients are 0. 1 and -0.1; the dotted line represents the trend line between the peak frequency and the two-way travel time). b: For a same polarity reflection coefficient pair of interfaces (The diamond represents that the top-bottom reflection coefficients are 0. 6 and 0.4; the solid line represents the trend line between the peak frequency and the two-way travel time; the square represents that the top-bottom reflection coefficients are 0. 5 and 0. 5; the green dash line represents the trend line between the peak frequency and the two-way travel time; the triangle represents that the top-bottom reflection coefficients are -0. 1 and —0.1; the dotted line represents the trend line between the peak frequency and the two-way travel time) |
通过对不同厚度薄层正演模拟得知,在不考虑地层黏性吸收情况下,薄层地震响应特征在时频域具有-定规律性,这对小于1/4 波长的薄砂体的定性解释具有指导意义.
当薄层顶底反射系数极性相反时,其代表泥岩沉积背景中存在薄层单砂体的情况.总体说来,对于厚度小于1/4的薄砂体,反射复合波振幅谱有单峰值频率点,无陷频点或只是在低频端出现个数不等的微小陷频;峰值频率随着薄层厚度的减小而逐渐增大,且峰值频率要大于无薄层调谐作用时反射子波的峰值频率;无论是时域最大振幅还是频域振幅谱的最大幅度都随着薄层厚度的减薄而逐渐减小,说明此时的薄层具有升频降幅作用.当薄层厚度等于1/4波长时(调谐厚度),其瞬时频谱的峰值频率等于无薄层调谐作用时反射子波的峰值频率;无陷频或者在高频端存在微小幅度的陷频;此时瞬时振幅谱的最大幅度和时域最大振幅都取得最大值;在薄层厚度在1/4和1/2波长之间时,其具有双峰值频率点和单陷频点特征,且二者均随薄层厚度的增加而逐渐减小.时域最大振幅和振幅谱最大幅度随着薄层厚度的增加而减小;
薄层顶底反射系数极性相同多代表地层波阻抗连续增大的情况.对于薄层厚度小于1/4 波长的砂体,其以1/8波长为界,其瞬时振幅谱由单峰值频率点变为双峰值频率点,由无陷频点变为单陷频点;在接近1/4波长处,主峰值频率由大于1/4波长的高频率值跃降为低频率值,主峰值频率小于无薄层调谐作用时反射子波的峰值频率,并随薄层厚度的减小而逐渐增加并趋近于无薄层调谐作用时反射子波的峰值频率;无论是时域最大振幅还是频域振幅谱最大幅度都随着薄层厚度减薄而逐渐增大,并在薄层厚度趋近于0时,趋近于无薄层调谐作用时反射子波的幅度的2倍.说明此时的薄层具有升幅降频作用;当薄层厚度等于1/4波长时(调谐厚度),其瞬时频谱的峰值频率发生跃变,大于不存在薄层调谐作用时反射子波的峰值频率,而陷频频率等于无薄层调谐作用时反射子波的峰值频率;此时瞬时振幅谱的最大幅度和时域最大振幅都取得最小值,且都小于无薄层调谐作用时反射子波的幅度值;当薄层厚度介于1/4和1/2波长之间时,其以3/8 波长为界,瞬时振幅谱由双峰值频率点变为三峰值频率点,由单陷频点变为双陷频点,且主峰值频率要大于无薄层调谐作用时反射子波的峰值频率;主、次峰值频率均随薄层厚度的增加而逐渐减小.瞬时振幅谱最大幅度随着薄层厚度的增加而增加,并在1/2 波长处取得极大值,而时域最大振幅随着薄层厚度的增加而缓慢增加,在1/2波长之后趋于稳定.
综上分析可知,薄层砂体虽然垂向上厚度薄,但是横向上会具有较大分布范围,因此,在频域水平切片上,其频率特征参数受反射系数影响较小,会在较大范围内稳定分布,并有着相同的变化规律[29-31],因此,有理由相信,通过联合薄层时域特征参数和频域特征参数可以定性识别薄砂体,并进而预测薄砂体的空间分布范围[32-33].
在薄层厚度定量分析预测方面,由于已知峰值频率倒数的平方和薄层时间厚度的平方具有线性关系.因此,可以利用过井地震剖面来标定这-关系,即:在关键井中,先通过电阻率测井曲线准确解释薄层厚度,然后对井旁地震数道进行时频分析,获取不同厚度薄层的瞬时频谱的峰值频率大小,然后在τ2 -1/fp2 坐标系下拟合得到二者之间的线性关系.对于非井旁地震道可利用该线性关系定量预测薄层厚度,结合薄层定性识别结果,可以有效增加解释结果的可信度.
6 结 论薄层的顶底反射系数极性不同,其时域和频域特征参数的变化规律是大不相同的;总体说来,当反射系数极性相反时,薄层具有升频降幅的作用;极性相同时具有升幅降频作用.即使在同-极性情况下,不同厚度范围内的薄层,其时域和频域特征参数的变化规律也是大不相同的.因此,可以根据峰值频率大小、个数、间距结合时域最大振幅及视厚度变化来定性识别小于1/4波长的薄砂体.
时域振幅往往要受到反射系数大小、极性、透射损失和储层非均质性等众多因素的干扰,在薄层厚度预测方面缺乏稳定性,容易在储层厚度预测方面出现误差.薄层瞬时频谱的峰值频率和陷频频率对反射系数大小与极性变化不敏感,具有较好的稳定性,影响因素较少,与薄层厚度具有很好的相关性,因此,可以利用这-规律来定量预测薄层厚度.
致谢非常感谢审稿人对本文所提出的宝贵建议;感谢本文编辑对文章所做出的细致修改!
| [1] | Widess M B. How thin is a thin bed?. Geophysics , 1973, 38(6): 1176-1180. DOI:10.1190/1.1440403 |
| [2] | Kallweitt R S, Wood L C. The limits of resolution of zero-phase wavelets. Geophysics , 1982, 47(7): 1035-1046. DOI:10.1190/1.1441367 |
| [3] | 苏盛甫. 薄储集层的反射特征和定量解释方法. 石油地球物理勘探 , 1988, 23(4): 387–402. Su S F. Thin-reservoir reflection and the quantitative interpretation method. Oil Geophysical Prospecting (in Chinese) , 1988, 23(4): 387-402. |
| [4] | 凌云, 郭向宇, 高军, 等. 油藏地球物理面临的挑战与发展方向. 石油物探 , 2010, 49(4): 319–336. Ling Y, Guo X Y, Gao J, et al. The technical challenges on the development trend of reservoir geophysics. Geophysical Prospecting for Petroleum (in Chinese) , 2010, 49(4): 319-336. |
| [5] | 王润秋, 李兰兰, 李会俭. 塔里木地区勘探地震正演模拟研究. 地球物理学报 , 2010, 53(8): 1875–1882. Wang R Q, Li L L, Li H J. Forward modeling research for seismic exploration of Tarim area. Chinese J.Geophys. (in Chinese) , 2010, 53(8): 1875-1882. |
| [6] | Gochioco L M. Modeling studies of interference reflections in thin layered media bounded by coal seams. Geophysics , 1992, 57(9): 1209-1216. DOI:10.1190/1.1443336 |
| [7] | Gochioco L M. Tuning effect and interference reflections from thin beds and coal seams. Geophysics , 1992, 56(8): 1288-1295. |
| [8] | Knapp R W. Energy distribution in wavelets and implications on resolving power. Geophysics , 1993, 58(1): 39-46. DOI:10.1190/1.1443350 |
| [9] | De Voogd N, den Rooijen N. Thin-layer response and spectral bandwidth. Geophysics , 1983, 48(1): 12-18. DOI:10.1190/1.1441400 |
| [10] | 凌云, 西晓宇, 孙德胜, 等. 薄储层叠后反演影响因素分析与地震属性解释研究. 石油物探 , 2008, 47(6): 531–558. Ling Y, Xi X Y, Sun D S, et al. Analysis on affecting factors of post-stack inversion and seismic attribute interpretation of thin reservoir. Geophysical Prospecting for Petroleum (in Chinese) , 2008, 47(6): 531-558. |
| [11] | 孙鲁平, 郑晓东, 首皓, 等. 薄层地震峰值频率与厚度关系研究. 石油地球物理勘探 , 2010, 45(2): 254–259. Sun L P, Zheng X D, Shou H, et al. The study of relation between thin-layer thickness and peak frequency. Oil Geophysical Prospecting (in Chinese) , 2010, 45(2): 254-259. |
| [12] | Okaya D A. Spectral properties of the earth's contribution to seismic resolution. Geophysics , 1995, 60(1): 244-251. |
| [13] | Marfurt K J, Kirlin R L. Narrow-band spectral analysis and thin-bed tuning. Geophysics , 2001, 66(4): 1274-1283. DOI:10.1190/1.1487075 |
| [14] | Partyka G A, Gridley J M, Lopez J. Interpretational applications of spectral decomposition in reservoir characterization. The Leading Edge , 1999, 18(3): 353-360. DOI:10.1190/1.1438295 |
| [15] | Pinnegar R C, Mansinha L. The S-transform with windows of arbitrary and varying shape. Geophysics , 2003, 68(1): 381-385. DOI:10.1190/1.1543223 |
| [16] | 高静怀, 陈文超, 李幼铭, 等. 广义S 变换与薄互层地震响应分析. 地球物理学报 , 2003, 46(4): 526–532. Gao J H, Chen W C, Li Y M. Generalized S transform and seismic response analysis of thin interbeds. Chinese J. Geophys. (in Chinese) , 2003, 46(4): 526-532. |
| [17] | 陈学华, 贺振华, 黄德济, 等. 时频域油气储层低频阴影检测. 地球物理学报 , 2009, 52(1): 215–221. Chen X H, He Z H, Huang D J, et al. Low frequency shadow detection of gas reservoirs in time-frequency domain. Chinese J.Geophys. (in Chinese) , 2009, 52(1): 215-221. |
| [18] | Koefoed O, De Voogd N. The linear properties of thin layers, with an application to synthetic seismograms over coal seams. Geophysics , 1980, 45(8): 1254-1268. DOI:10.1190/1.1441122 |
| [19] | 凌云研究小组. 应用振幅的调谐作用探测地层厚度小于1/4波长地质目标. 石油地球物理勘探 , 2003, 38(3): 268–274. Ling Yun study group. Application of amplitude tuning in surveying geologic target thickness less than 1/4 wavelength. Oil Geophysical Prospecting (in Chinese) , 2003, 38(3): 268-274. |
| [20] | Zeng H L. How thin is a thin bed? An alternative perspective. The Leading Edge , 2009, 28(10): 1192-1197. DOI:10.1190/1.3249773 |
| [21] | Marangakis A, Oostalnt J K, Coruh J. Use of integrated energy spectra for thin-layer recognition. Geophysics , 1985, 50(3): 495-500. DOI:10.1190/1.1441927 |
| [22] | Puryear C I, Castagna J P. An algorithm for calculation of bed thickness and reflection coefficients from amplitude spectrum: 76th Ann. Internat Mtg., Soc. Expl. Geophys., Expanded Abstracts , 2006: 1767-1770. |
| [23] | Charles I P, Castagna J P. Layer-thickness determination and stratigraphic interpretation using spectral inversion: Theory and application. Geophysics , 2008, 73(2): R37-R48. DOI:10.1190/1.2838274 |
| [24] | Rubino J G, Velis D. Thin-bed prestack spectral inversion. Geophysics , 2009, 74(4): R49-R57. DOI:10.1190/1.3148002 |
| [25] | Robertson J D, Nogami H H. Complex seismic trace analysis of thin beds. Geophysics , 1984, 49(4): 344-352. DOI:10.1190/1.1441670 |
| [26] | Zeng H L. Geologic significance of anomalous instantaneous frequency. Geophysics , 2010, 75(3): P23-P30. DOI:10.1190/1.3427638 |
| [27] | Knapp R W. Vertical resolution of thick beds, thin beds, and thin-bed cyclothems. Geophysics , 1990, 55(9): 1183-1190. DOI:10.1190/1.1442934 |
| [28] | Chung H M, Lawton D C. Frequency characteristics of seismic reflections from thin beds. Canadian Journal of Exploration Geophysics , 1995, 31(1): 3-37. |
| [29] | 凌云研究组. 地震分辨率极限问题的研究. 石油地球物理勘探 , 2004, 39(4): 435–442. Ling Yun Research Group. Study of seismic resolution limit. Oil Geophysical Prospecting (in Chinese) , 2004, 39(4): 435-442. |
| [30] | 姚陈, 蔡明刚, 王赟. 各向同性薄层反射理论地震图. 地球物理学报 , 2010, 53(1): 164–170. Yao C, Cai M G, Wang Y. Synthetic seismograms of reflection from isotropic thin layer. Chinese J.Geophys. (in Chinese) , 2010, 53(1): 164-170. |
| [31] | 杨真, 冯涛, WangS G. 0.9 m薄煤层SH型槽波频散特征及波形模式. 地球物理学报 , 2010, 53(2): 442–449. Yang Z, Feng T, Wang S G. Dispersion characteristics and wave shape mode of SH channel wave in a 0.9m-thin coal seam. Chinese J.Geophys. (in Chinese) , 2010, 53(2): 442-449. |
| [32] | Lange J N, Almoghrabi H A. Lithology discrimination for thin layers using wavelet signal parameters. Geophysics , 1988, 53(12): 1512-1519. DOI:10.1190/1.1442432 |
| [33] | Almoghrabi H, Lange J. Layers and bright spots. Geophysics , 1986, 51(3): 699-709. DOI:10.1190/1.1442123 |