 2010, Vol. 53


 , ZHAO Bi-Ru2, QIAN Wei3, ZHAO Guo-Ze4, ZHAO Jian2, HE Shi-Gen5, ZHANG Hong-Kui6, LI Shi-Yu1, LU Jun7, QIAN Fu-Ye1
2. Tianjin Hi-tech Development Co. Ltd, Tianjin 300201, China;
3. Department of Physics, University of Toronto, L6C, 1V9, Canada;
4. Institute of Geology, CEA, Beijing 100029, China;
5. College of Disaster Prevention Techniques, Yanjiao, Hebei Province 065201, China;
6. Earthquake Administration of Beijing Municipality, Beijing 100080, China;
7. China Earthquake Network Center, Beijing 100036, China
2. 天津海泰光电科技有限公司, 天津 300201;
3. Department of Physics, University of Toronto, L6C, 1V9, Canada;
4. 中国地震局地质研究所, 北京 100029;
5. 防灾科学技术学院, 河北三河 065201;
6. 北京市地震局, 北京 100080;
7. 中国地震台网中心, 北京 100036
Since the 1966 M7.2 Xingtai earthquake, permanent observatories have been set up in some of the major earthquake zones in China to investigate earthquake precursor of geoelectric resist-vity and current field[1]. Precursors to the 1976 M7.8 Tangshan earthquake have been found, e.g. decrease of geoelectric resistivity[2~5], geo-resist-vity impulse related to tidal force M2 wave[6], and geo-current field changes related to tidal force MSf[7, 8]. A model of short-term earthquake precursor of tidal force has been established in accordance[9, 10]. The PS100 anti-interference high-precision geoelectric measurement system has been developed to overcome the instability of electrode polarization, the interference of the natural electromagnetic field, and especially the interference of random current due to industrialization, which will prevail on the globe. This system utilizes the Code Division Multiple Access (CDMA) technique and the concept of black box to the earth-resistivity measurement instrument. It applies convolution and deconvolution to the encoded input time series and the observed output time series, and identifies the value of georesistivity with eliminated electromagnetic interference[11]. Specification tests have been conducted by China National Institute of Metrology regarding the anti-interference ability of the PS100 system. APS100 system had measured the resistance of a 0.01% measuring resistance, on which interference voltage from a signal generator (as source of the interference) was applied. The results1) indicate that when the signal-to-noise ratio was between 20dB and 0dB, both the difference between the detected and true values and the standard deviation of multiple measurements were better than 0.1% (between 0.01 % at 20 dB and 0.1% at 0 dB).
1) No. of certificate: DCcm 2004-0012. and the calibration/measurement described in this certificate, as on item of the Calibration Measurement Capabilities (CMC) of National Institute of Metrology (NIM) in DC and low frequency (IMHz and below) of electromagnetic metrology field, has been listed in the Appendix C of MRA and can be found in the BIPM's website: http://kcdb.bipm.fr/BIPM-KCDB/AppendixC/search.asp?MET=EM
Four sets of PS100 systems has been recording at 4 stations in Sichuan and Yunnan (MN station at 28.532°N, 102.169°E, HG station at 26.544°N, 101.928°E, YM station at 25.690°N, 101.861°E, and LJ station at 26.837°N, 100.245°E) since April 2004(Fig. 1)

|
Fig. 1 PS-100 HRT station deployment and the distribution of epicentres of earthquakes, before which the HRT wave were recorded (The case number in brackets is the same in Table 2) |
In our two internal reports to the China Earthquake Administration in 2003, we pointed out that along the middle segment of the North-South Earthquake Zone (within 200~300 km from the MN station), it is likely that a huge earthquake occur in the next two to three years[12]. Because of this judgment, we deployed four PS-100HRT stations under an emergency funding from the China Earthquake Administration to confirm the HRT earthquake prediction method. Since the April of 2004, these four stations have been running continuously to capture the HRT waves[13]. The most northern station MN is 288 km away from the epicentre of the Wenchuan earthquake (Fig. 1). The station and earthquake epicentre are within the boundary zone (about 105°E) between the East and the West Interaplate Blocks in China. The four PS100HRT system recorded geo-resistivity with a standard deviation of less than 0.1%. For some points with signal to noise ratio < 0 dB, the measurement precision is better than 0.17%. This demonstrate that our network can capture the tiny HRT precursor waves[14, 15]. The four geo-electric stations have been running continuously since the beginning of 2004. Baseline behaviour of the data is well understood. At each station, we took a special measure to eliminate the influence of the surface layer. To remove shallow ground-water seasonal variations[16, 17], the detection depth is ensured to reach 300 m with current electrodes separation of more than 1000 m. To reduce the polarization instability, the electrodes are made of stable lead plank. At each station, there are three completely independent resistivity monitoring systems (instrumentation, electrodes, wires, etc.) and in each direction, there are two synchronous channels to measure the electric resistivity (ρx) and telluric potential (ΔV). The electric resistivity and telluric potential are measured every live minutes and variance of the data is given every hour. Data are transferred to a control center in Beijing through a public network in real time. The time base in each station is synchronized. The standard deviation of the hourly geo-resistivity measurements at the four stations are less than 0.1%.
3 The Model (Mechanism) of HRT Wave and Its Implications to Earthquake 3.1 Appliance of some theories of acoustics to the HRT precursor wavesIn the focal zone, the earth material is porous with fluids. The earthquake forming process will create disturbances to the fluids in the pore. The characteristics of the fluid low are an important factor to control the mechanical behaviours of the Earth medium. Small disturbances of the acoustic pressure superimposed on the balanced value of the pore pressure plays an important role in the earthquake forming processand precursors[18~21]. The geo-electric properties of rocks (geo-resistivity and geo-current) are mostly related to pore fluids. Because of this relationship, scientists in many countries (Japan, Russia, USA, Greece, etc.) have paid great attentions to the geo-electric (resistivity and geo-current) precursor studies. In recent years, much of the attention has been paid to geo-current studies[22~31].
For earthquake prediction, it is necessary to establish a model. In addition, all parameters involved changes with time and its dynamics need to be characterized. The difficulty of earthquake prediction comes from that the earthquake forming process and precursor mechanism so far are not understood by people. Motivated by the observations before the 1976 Ms7.8 Tangshan earthquake and in consideration that the tidal force is well understood, it appears everywhere and its period is far larger than the natural period of the fault system, we choose the tidal force as the "input signal" and geo-resistivity and telluric current as "output signal" due to its sensitivity to pore fluid disturbance. By using of process recognition[32] technology, we are able to establish the HRT wave model for earthquake prediction and quantitatively estimate the mathematical model and its parameter variations.
In acoustics[33], we shall make a start by looking at the simplest case, that of an idealized fluid, uniform and continuous in its properties, at rest in thermodynamic equilibrium, except for the motion caused by the sound waves themselves, and with this acoustic mode motion small enough in magnitude so that many nonlinear effects are negligible and the equation of motion takes on its simplest form. In the presence of a sound wave the pressure becomes P + p. Because a acoustic pressure (p) gradient produces an acceleration of the fluid, we have the wave equation[33]:
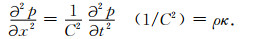
|
(1) |
The equation can be brought into this form by defining an effective fluid density ρ, compressibilit κ, and wave velocity C, for the fluid in the pores, which is the wave equation of porous media for simple-harmonic waves. We start by considering the propagation of a plane wave in a uniform porous media of infinite extent, at rest in the absence of sound. We have already known[33] that a general solution of the wave equation (1), traveling in the positive x direction's given by the function p(x-Ct).This represents a wave of constant form p(z), traveling with constant speed C. And then we consider that the effect of the change (p) of confining pressure (P), which is coming from the source on the pore pressure change (pp) in medium under a station. We have already known[34] that discussion of the general situation is quite complicated and only two kinds of simply special cases are discussed here: one is undraind case, in which pp is proportional to p; and the other is draind case, in which pp keeps no changing, unrelated to p.
In the earthquake forming process, the coupling of the solid rock matrix and its pore fluid will modify the wave velocity of both parts of the porous crust. Here, as an example, let us have a look at the plane-wave solution and show that there are two possible waves with two veloci-ties in the porous rocks[33]. This particular example shows that the wave with velocity near Cf has most of its energy in the fluid motion (the HRT wave); that with velocity near Cs carries most of its energy in motion of the solid network (seismic wave).
Considering viscosity of the pore fluids, pore fluid motion should be expressed with the full expression of each component of the viscosity-stress tensor. From the Stokes-Navier equation of motion of a viscous, compressible fluid, it can be shown[33] that the lluid velocity u can always be uniquely separated into a longitudinal part u1, for which curl u1=0, related to p and a transverse part ut, for which divut=0, unrelated to p and therefore we know that the RT wave always has longitudinal and transverse waves simultaneously.
On the whole the geo-electric properties of rocks (geo-resistivity and geo-current) can directly or indirectly reflect this displacement (strain) or velocity (strain rate) and can be very sensitive to small strain or its rate. Therefore the electric parameters observed at stations can be very sensitive to small stress-strain waves.
To circumvent the difficulty of the earthquake prediction, solving the prediction practical problem and finding the operational way of earthquake prediction, Biru Zhao suggested treating the earthquake process as a "black box". Using the system recognition technology[32] in the modern control theory, we can calibrate this "black box" mathematically with different input and output parameters. Similar to the "probing method" in industrial engineering such as in order to determine whether there exists a crack, people listens to the sound from that a hammer beats a wheel & axle of train; or from that a bowl is touched by another bowl. In order to determine whether there exists an earthquake source, we analyze the HRT wave recorded before an earthquake and consider earthquake prediction as a systematizing engineering and can establish a mathematical model for this "black box". This will enable us to better understand the earthquake forming and precursor mechanism.
3.2 The model (mechanism) of HRT wave and its implications to earthquake prediction
From the rock mechanic experiments[35], right before an earthquake, the stiffness of the epicentre medium 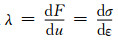

|
Fig. 2 Schematic diagram showing the model (mechanism) of HRT wave (a, b, c) Schematic diagram showing the model (mechanism) of HRT wave; (d) The measured HRT wave cases prior to the Ludian earthquake on 10th of August, 2004 (cf. No.16 in Table 2), which can be compared with the model. |
We can see that the quasi-steady initial loading F0(in our modal) is analogous to the equilibrium pressure P (in acoustics) and the amplitude of tidal force is analogous to acoustic pressure (p). When λ continues to decrease and as the period T0 (the natural period of the fault system) equals to the period of the input signal.
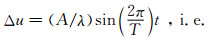
From Fig. 2c we can see that physical indicators to short-term and/or impending stages of an earthquake forming process and we can see that in the early stage (medium term stage) of an earthquake forming process, the epicentre medium is at an elastic stage and rock stiffness λ is a large, positive number. In this case, the geo-electric response due to tidal forces is very small (between 0.05 % and 0.1%) as the curve E-t shows. When the stiffness approaches zero (short-term stage), the displacement of the medium (mostly the pore fluids and electric response) in the epicentre region follows the variation of that of tidal force (the period equal to that of the tidal force) while the amplitude is inversely proportional to the stiffness λ (Although Δu is proportional to A, but normally A changes little. Therefore the electric response is inversely proportional to λ.) and increases dramatically, i.e., when 

From the HRT wave model, we can see that the negative stiffness value (i.e. the descending slope of a constitutional relationship curve) is a necessary condition for the instability (earthquake) of the fault, i.e., the medium, mostly due to the pore fluid, in the epicentre area has a stiffness of λ≤0. In this stage, the medium in the epicentre area will produce harmonic oscillation (the period equal to that of the tidal force) HT wave. Right before the earthquake when the period of the driving force equals to the natural period T0, the resonance oscillation RT wave will be emitted resonantly. The weak, but clear HRT wave is propagating from the epicentre and being recorded by our anti-interference geo-electric monitoring instrument (PS-100HRT) network. When a network of monitoring stations received such waves, we can predict the upcoming earthquake from the spacial and temporal variations of the HRT waves.
4 Cases of RHT Wave, the Characteristics of Wave Motion and RegularityA network of PS100 stations in Sichuan and Yunnan, China has recorded the HRT precursor wave to the Mw9.0 Sumatra tsunami earthquake on December 26th2004. This is the first record of precursor wave. Thereafter, we have captured HRT waves from more than twenty strong earthquakes, which are well-matched and show repeatability, consistency and regularity.
4.1 HT waveFig. 3a shows that three month before the Sumatra earthquake, there are half-month period HT waves recorded at MN station with increasing amplitude (maximum of 2.4%). This is 20 times of the standard deviation of the measurement. Half a month after the earthquake, the HT wave disappeared and there is no appearance of the HT wave from January 2005 to May 2005. Therefore the half-month period HT waves prior to three month before the earthquake are short-term precursor wave to the Sumatra earthquake (cf. No.1 in Table 2).

|
Fig. 3 HT waves to Sumatra Mw9.0, Wenchuan Ms8.0 and Sumatra Ms8.7 earthquakes (a) HT wave prior to the Sumatra Mw9.0 earthquake [3.15°N, 91.79°E; 08:58:51.1(Beijing time)]on 26th of December, 2004; (b) HT wave prior to the Sumatra Mw9.0 earthquake recorded from 2004-12-01 to 2005-01-06; (c) HT wave prior to the Sumatra Ms8.7 earthquake [2.07°N, 97.01°E; 00:09:36] on 29th of March, 2005; (d) HT wave 7 and half day variations prior to the Wenchuan Ms8.0 earthquake [31.0°N, 103.4°N; 2008-05-12 14:28:04]; (e) HT half-month variations prior to the Wenchuan Ms8.0 earthquake; (f) Before the Wenchuan Ms8.0 earthquake, HT wave in NW channel recorded every 5 minutes, corresponding to stiffness λ=0 in the epicentre region. |
Comparing Fig. 3b with Fig. 3c, we can see that there are similar patterns of half-month period HT waves, but different amplitudes and that of the wave prior to the Sumatra Ms8.7 earthquake (cf. No.2 in Table 2) is smaller.
From Figs. 3d and 3e, we can see that before the Wenchuan Ms8.0 earthquake, the NW channel of HG station shows the HT half-month and three 7-day period variations with increasing amplitude (cf. No. 10 in Table 2). About 10 hours before the earthquake, the geo-resistivity decreased for about 1.0%. This is 10 times of the standard deviation of the measurement. From Fig. 3f we can see two half-day period variations indicating that the medium stiffness λ≤0. That is, from 4 May 2008 to 6 May 2008, there are two half-day period variations indicating that the stiffness of medium in the epicentre area changes from "+" to "-" and the resonance oscillation RT wave and the earthquake is coming up.
4.2 Cases of RT wave and the characteristics of wave motionFig. 4a is the hourly measurements of geocurrent at MN station. Fig. 4b is the 5-minute measurements of geo-resistivity at MN station (Δ=2903 km, Az=-12.8°). Fig. 4c is the 5-minute measurements of geo-resistivity at HG station (epicentral distance to Sumatra earthquake Δ=2686 km, azimuth Az=-13.5°) during December 24 to 29, 2004. The two stations were in the first P-wave arrival "+" zone of the Mw9.0 Sumatra earthquake. According to the results of in situ experiments, geo-resistivity decreases when com-pressing[36~38]. There were two obvious minima of geo-resistivity after the earthquake atHGand MN stations, a, b and a', b', respectively. Corresponding to a, a', there was a remarkable extreme value of geo-current a'' at MN station. Comparing the time of the minima at the two stations, a propagation phenomenon of significance can be found. (Time service of all the stations was offered by the control center, error from CST within 1 s.) The minima a, b at HG station were earlier than a', b' at MN station, respectively. Accordingly, phase velocity of the RT wave was about 306 km/h. Multiplying the travel times of the minima a, a from the Mw9.0 earthquake with the phase velocity obtained above, we have, source of the electric signal was 2.64 × 10³ km away from HG station, and 2.89 × 10³ km from MN station, close to the real epicentral distances of the two stations, respectively. This indicates that the electric signal was generated at the same location and time as the Mw9.0 Sumatra earthquake, i. e. the first minima of geo-resistivity (a, a') and the first extreme value of geo-current (a'') after the earthquake are the coseismal effects of the Sumatra earthquake. The signal did not arrive at MN station until 9 hours later than the earthquake only because of its low propagation velocity.

|
Fig. 4 Comparison of the RT waves (a) Hourly measurements of geo-current at MN station on December 24th~28th, 2004;(b)5-minite measurements of geo-resistivity at MN station on December 24th~28th, 2004; (c) 5-minite measurements of geo-resistivity at HG station on December 24th~28th, 2004; (d) RT waves 2 days before the Mw9.0 Sumatra earthquake; (e) Comparison of the RT waves prior to 5 earthquakes. |
Fig. 4d gives the resonance waves (RT waves) 2 days before the Mw9.0 Sumatra earthquake at MN station. At resonance T=T0, where the wattles component of the impedance is equal to zero, the amplitude of fluid velocity is inversely proportional to the acoustic impedance Rm (i. e. watt component). That RT wave controlled by acoustic impedance appears in a fault system indicates an earthquake is impendent, e.g. within 1~3 days, according to the experience of a few earthquakes. If the acoustic impedance is small during resonance, which is usual, the peak will be very sudden and sharp, with magnitude as large as 2.9%, 17 times larger than the standard deviation of the observations, resulting in a remarkable anomaly.
In Fig. 4d there are 2 RT waves, an earlier decreasing one and a later increasing one (different from RT waves of the Jiujiang earthquake, increasing then decreasing), with arrival time difference about 14 h at MN station, which is of significance (cf. No.1 in Table 2).
Fig. 4e compares RT waves of several earthquakes. The curves from top to bottom are the records of RT waves before the Ms7.6 Banda Sea earthquake at MN station, the M7.8 Pakistan earthquake of 2005-10-08 at YM station and at MN station2), the Ms5.7 Jiujiang earthquake at HG station and at MN station, and the M5.6 Ludian, Yunnan earthquake of 2004-08-10 at MN station, respectively. The arrival time of the primary RT waves before the earthquakes were aligned. It shows that the arrival time of the second RT wave was a function of epicentral distance of the station. In general, the arrival time of the second RT wave was delayed more greatly when the epicentral distance was larger, i.e. the arrival time difference between the primary and the second RT waves increased with the epicentral distance.
2) Three distant specification tests were conducted by the control center in Beijing on 2005-08-12, 2005-10-04, and 2005-10-10, for the working state of the PS100 system at MN station. The result indicated that during the specified time period (August 12 to October 10, 2005), the PS100 system was stable. Therefore, the observed geo-resistivity anomalies before the Pakistan earthquake are real.
It must be noted that the PS100 stations were in the first P-wave arrival "-" zone of the Ms5.7 Jiujiang earthquake (According to the results of in situ experiments, increasing of geo-resistivity is due to dilatation[36]), so that the RT waves at the three stations increased at first and then decreased one day before the earthquake; whereas for the other earthquakes the stations were in the "+" zone so that the RT waves decreased before increased 1~3 days before the earthquakes.
4.3 Cases of RT wave and its mechanismFig. 5a shows the relation of arrival time and epicentral distance from several earthquakes to the four stations. The points representing Sumatra earthquake (YN) to MN station, to HG station, the Ms5.7 Jiujiang, Jiangxi earthquake (JJ) of 2005-11-26 to MN station and points of some other cases nicely fall onto a straight line of velocity of 307 km/h.

|
Fig. 5 Cases of RT wave and its mechanism (a) Velocity curve of geo-electric RT wave (longitudinal) and the propagation velocity related to pore pressure changes calculated from the data of large and small earthquakes; (b) The geo-resistivity measurement at MN and telluric field measured at HG two days before and one day after the Sumatra earthquake; (c) RT longitudinal and transverse waves of geo-resistivity before the Mw9.0 Sumatra earthquake and its ellipse of principal stress; (d) Vector graph of the RT longitudinal and transverse waves of geo-current field during the Mw9.0 Sumatra earthquake. |
From the opinion that shallow strong earthquakes can result in significant transient changes of pore pressure, while pore pressure changes can cause some of the moderate and small earthquakes[21], we plotted the points of the distance difference and the time difference between large and small earthquakes representing the Mw9.0 Sumatra earthquake (2004-12-26, 08:58: 51. 1 CST, 3.15°N, 95.79°E), and the Ms5.0 Chuxiong (CX) earthquake (2004-12-26, 15 : 30:13.9 CST, 24.76°N, 101.75°E), and the Ms7.6 Banda Sea earthquake (2006-01-28, 00:58:50.5 CST, 5.4°S, 128.1°E), and the Ms4.8 Yongsheng (YS) earthquake (2006-01-28, 15:02:01.4 CST, 26.3°N, 100.8°E) on Fig. 5a (cross-triangles), and found that the points of large and small earthquakes were all close to the straight line of velocity 307 km/h obtained from geo-electricity data. This indicates that for both large and small earthquakes, propagation velocity of waves related to pore pressure was consistent with the phase velocity of RT longitudinal wave calculated from geoelectricity data. That is, a type of acoustic waves with velocity much lower than that of seismic waves does exist in the crust, energy propagating mainly in pore fluids in the porous rocks of the crust. It has been proved[33] that there are two possible types of waves in elastic porous media: one is seismic waves, with velocity close to the wave velocity in the solid framework, and most of the energy propagating during the motion of the framework; the other type of waves is acoustic waves with most of its energy propagating in the motion of pore fluids, and velocity close to the wave velocity in the pore fluids. Coupling of the two types of waves makes the seismic waves in the solid framework becoming faster, and the acoustic waves in the pore fluids becoming slower. The RT wave belongs to the latter type.
Fig. 5b's upper panel shows the geo-resistivity measurement every five minutes at MN and lower panel is telluric field measured every five minutes at HG. From Fig. 5b, we can see that two days before and one day after the Sumatra earthquake, i.e., on 25th, 26th and 27th of December, 2004, both geo-resistivity and telluric field start to show step-like variations (basically one step a day), and MN station shows retard compared to HG station. This is because MN station has a larger epicentre distance Δ=2903 km than the HG station Δ=2686 km, thereby it takes longer time for the HRT wave to propagate to the MN station. This measurement confirms the existence of the HRT wave.
From Fig. 5b, the most interesting phenomenon is that the width of the step becomes longer daily. It is 4.5 hour on 25th; 9 hour on 26th and 13.5 hour on 27th. From this figure, we can clearly see the Doppler effect, i.e., the natural period T0 becomes longer before the earthquake (25th and 26th) due to the fluid movement in the fault (from a pipe model) before earthquake rapture[33]. We think this is due to the pore fluid movement along the fault during pre-rapture fault.
According to the results of in situ experiments of geo-resistivity changes[36~38] and the method to calculate the anomaly parameters of geo-resistivity heterogeneity[39]. Fig. 5c gives the effective resistivity ellipses before the MW9.0 Sumatra earthquake calculated from the three-component geo-resistivity values at the stations, to describe the directions of the principal stress. We can see, the primary wave was longitudinal wave, and the second wave was transverse wave. Left panel in Fig. 5c shows first motion of P-wave positive (+). a-a' resistivity decrease (compression) and the propagation direction of the RT wave is in parallel to the maximum principal stress direction. This is the compression mode wave propagation. Middle panel shows b-b' resistivity increase (expansion) and the propagation direction of the RT wave is perpendicular to the maximum principal stress direction. This is the shear mode wave propagation. Right panel shows the three component georesistivity values at the MN station. The distance between the MN station and Sumatra Mw9.0 earthquake epicentre is 2903 km. The resistivity decrease (a-a') happens 48 hours before the earthquake, which leads b-b' resistivity increase by 14 hours.
Fig. 5d is the vector graph of the geo-current field, according to the three components of the geo-current field at MN station during the Mw9.0 Sumatra earthquake. We can see, as above, the primary wave was longitudinal wave, and the second wave was transverse wave. Relative to the occurring time of the Mw9.0 Sumatra earthquake, using the arrival times of the primary and the second RT waves of geo-current field, propagation velocities of the longitudinal and the transverse RT waves were determined: V1=346 km/h, Vt=126 km/h, respectively. Taking these values into the equation of virtual wave velocity Vv=(ViVt)/ (V1Vt)/(V1-Vt), we have, virtual wave velocity during the earth-quake was Vv=198 km/h, which is almost consistent with the RT virtual wave velocity before the earthquake 207 km/h (Fig. 6e). The arrival time difference of longitudinal and transverse geo-current fields during the earthquake was consistent with the arrival time difference of longitudinal and transverse waves of geo-resistivity before the earthquake. Therefore, it can be concluded that the RT waves (longitudinal, transverse, and virtual waves) appearing before the earthquake were emitted by the early nonseismic failure of the faults before the earthquake in the principal hypocenter area, because the arrival time difference of RT longitudinal and transverse waves and virtual wave velocity during the earthquake were consistent with the RT waves before the earthquake, and the RT waves during the earthquake were emitted by the fault break of the earthquake. That is, at least for the shallow large earthquakes investigated, modulated by tidal forces, non-seismic early fault failures had happened in the hypocenter areas 1~3 days before the earthquakes. Left panel in Fig. 5d shows the a-a' electric field is in the NE direction, parallel to the RT wave propagation (compression mode propagation). Middle panel shows the c-c' electric field is in the ES direction, perpendicular to the RT wave propagation (shear mode propagation). Right panel shows the three components of the geo-current field at MN station during the Mw9.0 Sumatra earthquake. The a-a' electric field at MN rises 8.4 hours after the earthquake. V1=346 km/h. The c-c' electric field rises 23 hours after the earthquake. Vt=126 km/h. Vv-V1Vt/(V1-Vt)=198 km/h.

|
Fig. 6 Cases of RT wave and its propagation (a) Case of RT wave to the two-Taiwan Ms7.0 earthquakes on December 26th, 2006;(b) Case of RT wave to the Kuril Islands Ms8.1 earthquake on November 15th, 2006;(c) Case of RT wave to the Banda Sea Mw 7.6 earthquake on January 28th, 2006;(d) The curve of earthquake magnitude (M) versus the natural period of the fault system (T0); (e) Velocity of RT virtual waves before the earthquakes. |
Fig. 6a shows example from the two-Taiwan Ms7.0 earthquakes on December 26th, 2006 and from which, we see that there are no changes 6~8 days before the earthquake. But since five days before the earthquake, we see RT wave with an increasing amplitude. The time difference for this RT wave is 10 hours, which gives an epicentre distance of about 2070 km. This agrees with the actual epicentre distance of 2019 km (cf. No.6 in Table 2). The amplitude increases to 1.5%, which is significant compared to the standard deviation of the measurements.
Fig. 6b shows example from the Kuril Islands Ms8.1 earthquake on November 15th, 2006. The epicentre distance estimated agrees with the earthquake tact (cf. No.5 in Table 2).
Example of HRT wave from the Banda sea Mw7.6 earthquake on January 28th, 2006 is given in Fig. 6c and which shows that MN recorded HRT wave 6 days before the earthquake with increasing amplitude daily but no change from 10 to 7 days before the earthquake. One day before the earthquake, the RT wave with amplitude of 2.3% appeared. The time difference between first sudden drop of RT wave and sudden rise of RT wave is 23 hours. From this, we estimated the epicentre distance is 4680 km. This agrees with the actual epicentre distance of 4683 km (cf. No.4 in Table 2).
The decay rate of the RT wave gives the natural period of the fault (see Fig. 4d). The earthquake magnitude can be predicted by M=4.14logT0 -1.486 (Fig. 6d), where T0 is measured in minutes.
Plotting arrival time difference of the two RT waves before a earthquake at each station Δt=tt -t1 with respect to the epicentral distance from the station to the coming earthquake Δ into Fig. 6e, we can see all the points are close to a straight line with virtual wave velocity Vv=(V1Vt)/(V1-Vt) ≈ 207 km/h, indicating that the virtual wave velocity were the same for those earthquakes. Hence, as long as arrival time difference of the two RT waves at one station is known, it is possible to calculate the epicentral distance of the coming earthquake quantitatively. With a network of appropriately distributed PS100 stations, epicenter of an earthquake about to occur can be determined 1~3 days in advance.
Therefore, it can be concluded that the RT waves (longitudinal, transverse, and virtual waves) appearing before the earthquake were emitted by the early non-seismic failure of the faults before the earthquake in the principal hypocenter area, because the arrival time difference of RT longitudinal and transverse waves and virtual wave velocity during the earthquake were consistent with the RT waves before the earthquake, and the RT waves during the earthquake were emitted by the fault break of the earthquake. That is, at least for the shallow large earthquakes investigated, modulated by tidal forces, non-seismic early fault failures had happened in the hypocenter areas 1~3 days before the earthquakes.
4.5 RT wave cases and its regularityFig. 7a shows example from Indonesia Ms8.5 earthquake on September 12th, 2007 and which shows that five days before the earthquake, there are RT waves (shaded area) recorded at MN station. From this, we estimated the magnitude and epicentre distance are in agreement with the actual earthquake parameters (cf. No.8 in Table 2).

|
Fig. 7 RT wave cases and its regularity (a) Example from Indonesia Ms8.5 earthquake on September 12th, 2007;(b) NW channel recordings of HRT waves recorded at HG before Wenchuan Ms8.0 earthquake; (c) NW channel recordings removed from long term changes; (d) Example from the M5.7 Jiujiang earthquake of 2005-11-26 at HG, MN and LJ stations; (e) Example from the M7.8 Pakistan earthquake of 2005-10-08 at YM, HG and MN stations and three distant specification tests. |
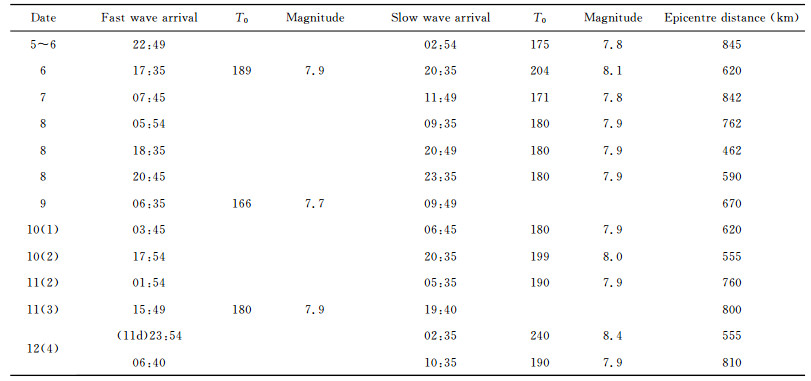
From Figs. 7b and 7c, we can see he half-day HRT variation with amplitudes several times the standard deviation of the measurements. Several days before the Wenchuan earthquake, the amplitude of the half-day variation starts to increase. Superimposed on top of the half-day variation, there are RT wave with the period of 3~4 hours. We can use these wavelets to obtain the magnitude and epicentre distance information. One day before the earthquake, RT wave reverse its trend indicating that the epicentre medium stiffness λ≤0.About 1 0 hours before the earth-quake, the geo-resistivity suddenly decreases for more than 1%, and there are 3 hour period variations present. This demonstrates the rapture length (earthquake magnitude) and epicentre distance (see Table 1 and No.10 in Table 2), which forms the strong earthquake warning signal. From Fig. 7c, we can see the NW channel with increasing amplitude of the RT variation (May 9th, 0.3%; May 10th, 0.5%; May 12th, 1.0%). Prediction results for epicentre distance and magnitude are shown in Table 1.
|
|
Table 1 Earthquake prediction results from the RT wave in EW channel for epicentre distance and magnitude |
|
|
Table 2 Cases of HRT wave |
The epicentre distance estimated at different times varies between 500 and 800 km. Because the epicentre is the north of HG station, the center of the pore fluid wave might move north-south. The center on May 12th was 555 km and 810 km, respectively. If we consider this difference to be the length of the rapture L=810 -555=255 km, migrating from south to north and we assume that this represents the two ends of the fault, we can estimate the rapture length. The magnitude can then be estimated by[40]: M=3.3 + 2.1logL=8.5. This is in good agreement both with the estimation shown in Table 1 and with the result of Zhang et al.[41].
The four stations in Sichuan and Yunnan are generally in a straight line of NS direction. The Ms5.7 Jiujiang earthquake was to the east of those stations; the Pakistan earthquake was to the west of the stations. The stations were generally on the same P-wave front of the two earthquakes, so the in-phase anomalies of the two earthquakes at three stations were shown in Figs. 7d and 7e respectively.
The Ms5.7 Jiujiang earthquake was to the east of those stations. The epicentre distance estimated agrees with the earthquake fact (cf. No.14 in Table 2).
Fig. 7e shows example from the M7.8 Pakistan earthquake of 2005-10-08 at YM, HG and MN stations and three distant specification tests were conducted by the control center in Beijing on 2005-08-12, 2005-10-04, and 2005-10-10, for the working state of the PS100 system at MN station. The resut indicated that during the specified time period (August 12 to October 10, 2005), the PS100 system was stable. Therefore, the observed the HRT waves before the Pakistan earthquake are real. The magnitude and epicentre distance of prediction are consistent with the facts of the earthquake (see No.3 in Table 2).
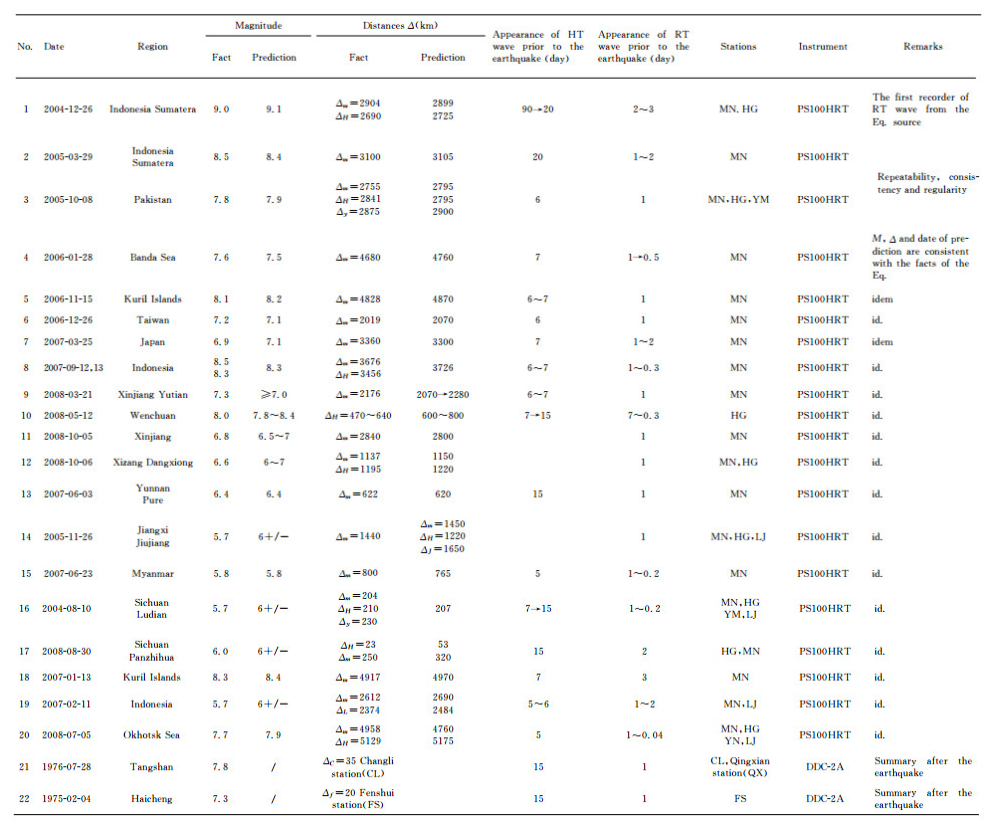
Cases of HRT wave and the consistency of prediction with the earthquake fact are shown in Table 2.
5 Conclusion and DiscussionThe HRT precursor wave has been recorded at four PS-100 stations in South-West China before more than twenty strong earthquakes. The HRT wave short-term and impending earthquake prediction method was developed on the bases of the former geoelectricity earthquake prediction method, which included earth-resistivity, MT, geocurrent field, artificial super low frequency (SLF) waves and seismic electromagnetic signals etc., and has been used in China for more than 40 years[42~59]. According to our two internal reports to the China Earthquake Administration in 2003[12], we got an emergency funding from the China Earthquake Administration and deployed four geo-electric monitoring stations in Sichuan and Yunnan provinces from 2004, using the new generation of equipment (PS-100) and technologies to capture the HRT wave earthquake precursor. The first record of HRT precursor wave has been recorded from the 26th/Dec/2004 Sumatra Mw9.0 earthquake with the largest epicentre distance Δ=2900 km. Thereafter, we have captured HRT waves from more than twenty strong earthquakes, which are well-matched and show repeatability, consistency and regularity. Before the Wenchuan Ms8.0 earthquake, we recorded the HRT wave precursor at the only operating station in Hongge (HG, Δ=465 km). We found that significant impending signal has a causal relationship with the Wenchuan earthquake recorded at the HG station in the early morning (0~5AM) of 12th/May/2008. These facts demonstrated that an earthquake, particularly a strong earthquake, has precursors, and it is predictable. Short-term or impending earthquake prediction is feasible in the near future. If we establish the PS-100HRT network of stations to a large scale, we might be able to predict earthquake in advance. The HT wave is generated by pore fluid movement driven by tidal force when the epicentre medium stiffness approa-ches zero before the earthquake. The RT wave is emitted by resonance when the natural period of the fault equals that of the driving tidal force. If we have a global PS100 network of appropriately distributed stations, accurate earthquake prediction will be possible in the near future.
AcknowledgementsThe HRT wave short-term and impending earthquake prediction method was developed on the bases of the former geo-electricity earthquake prediction method, which has been used for more than 40 years. This method was gradually developed with the supervision and effort of many colleagues in China Earthquake Administration. In particular, Gu Gongxu, Qin Xinling, Zeng Rongsheng, Xie Lili, Zhu Chuan-zhen, Luo Zhuoli, Guo Zengjian, Chen Yuntai, Ma Zongjin, ChenZhangii, Wu Zhongliang, Yang Jiansi, Chen Rong, Ma Jin, Xu Shaoxie, Mei Shirong, Che Shi, and many others have shared their research results and ideas with us. This has made a signiticant contribution to the development of the HRT short-term and impending earthquake prediction method. Yan Guliang, Wang Chengmin, Geng Qingguo and Lin Mingzhou offered support and encouragement for the composition of this article. The geoelectricity data are from a program funded by the China Earthquake Administration and its sub-division in Sichuan and Yunnan provinces.Professor Tang Yuxiong is acknowledged for diligently running the observatories. The seismic P-wave data is from the work of Li Baokun, Zhang Liwen and Qiu Haijiang. Thegravity tidal data was from the computation of Liu Duanfa.
| [1] | Zhao Y L, Qian F Y. Geoelectric precursors to strong earthquakes in China. Tectonophysics, 1994, 233: 99-113. DOI:10.1016/0040-1951(94)90223-2 |
| [2] |
赵玉林, 钱复业.
唐山7.8级强震前震中周围形变电阻率的下降异常. 地球物理学报, 1978, 21(3): 181–190.
Zhao Y L, Qian F Y. Electrical resistivity anomaly observed in and around the epicentre area prior to the Tangshan M7.8 earthquake of 1976. Acta Geophysica Sinica(in Chinese), 1978, 21(3): 181-190. |
| [3] | Qian F Y, Zhao Y L, Yu M M, et al. Geo-electric receptivity anomalies before earthquakes. Sci Sinica (Ser B), 1983, 26(3): 326-336. |
| [4] | Qian F Y, Zhao Y L, Lu J. Georesistivity precursors to the Tangshan earthquake of 1976. Anneli di Goofisica, 1997, 40(2): 251-260. |
| [5] | Gu G X. On the strategy of earthquake prediction.In:Coulomb J eds.Source Mechanism and Earthquake Prediction. Paris, 1980: 99-107. |
| [6] |
赵玉林, 钱复业.
唐山地震前后形变电阻率的脉冲. 地球物理学报, 1979, 22(1): 25–31.
Zhao Y L, Qian F Y. Short duration resistivity variations before and after the M=7.8 Tangshan earthquake.. Acta Geophysica Sinica(in Chinese), 1979, 22(1): 25-31. |
| [7] |
赵玉林, 钱复业.
唐山地震前后自然电场的周期变化. 地震学报, 1982, 4(3): 264–272.
Zhao Y L, Qian F Y. On certain periodic variations of the telluric electric field before and after the 1976 Tangshan M7.8 earthquake. Acta Seismologica Sinica(in Chinese), 1982, 4(3): 264-272. |
| [8] | Zhao Y L, Zhao B R, Qian F Y. Electrical streaming potential precursors to catastrophic earthquakes in China. Anneli di Geofisica, 1997, 40(2): 241-250. |
| [9] | Qian F Y, Zhao Y L, Xu T C, et al. A model of an impending-earthquake precursor of geoelectricity triggered by tidal forces. Phys Earth Planet Int, 1990, 62: 284-297. DOI:10.1016/0031-9201(90)90173-U |
| [10] | Qian F Y, Zhao Y L, Teisseyre R. Periodic anomalies of the telluric electric field before the Tangshan earthquake and a model of electrokinetic precursor triggered by tidal forces. Acta Geophysica Polonica, 1990, 38(3): 245-256. |
| [11] |
赵璧如, 赵健, 张洪魁, 等.
PS100型IP到端可控源高精度大地电测仪-CDMA技术首次在地电阻率测量中的应用. 地球物理学进展, 2006, 21(2): 675–682.
Zhao B R, Zhao J, Zhang H K, et al. The PS-100 high precision earth electricity measurement system (IP to IP) with controllable source-application of CDMA technology to the measurement of earth resistivity for the first time. Progress in Geophysics (in Chinese with English Abstract)(in Chinese), 2006, 21(2): 675-682. |
| [12] |
钱复业, 赵玉林.
关于"川滇地区1-3年可能发生特大地震的地电学方法监测应急措施方案"的建议(2003年12月). 国际地震动态, 2008(8): 1–12.
Qian F Y, Zhao Y L. A suggestion on monitoring geoelectric precursors in the earthquake risk region in Sichuan and Yunnan Province. Recent Developments in World Seismology (in Chinese with English Abstract)(in Chinese), 2008(8): 1-12. |
| [13] | Zhang H K, Zhao B R, Zhao Y L, et al. PS100 anti-interference electrical observation system and its application to earthquake prediction study. Physics and Chemistry of the Earth, 2006, 31(4-9): 172-181. DOI:10.1016/j.pce.2006.02.012 |
| [14] |
赵玉林, 赵璧如, 钱卫, 等.
印尼Mw9.0级地震的短临地电波(声波:潮汐力谐振共振波, HRT波)波动前兆-HRT波法进行短临地震准确预测可能性的探讨. 国际地震动态, 2006(8): 6–21.
Zhao Y L, Zhao B R, Qian W, et al. HRT wave precursor to the Sumatra earthquake:the feasibility of accurate earthquake prediction. Recent Developments in World Seismology (in Chinese with English Abstract)(in Chinese), 2006(8): 6-21. |
| [15] | Qian F Y, Zhao B R, Qian W, et al. Impending HRT wave precursors to the Wenchuan M_s8.0 earthquake and methods of earthquake impending prediction by using HRT wave. Science in China (Series D:Earth Sciences), 2009, 52(10): 1572-1584. DOI:10.1007/s11430-009-0124-x |
| [16] |
钱复业, 赵玉林, 许同春.
地电阻率季节干扰变化分析. 地震学报, 1987, 9(3): 289–302.
Qian F Y, Zhao Y L, Xu T C. An analysis of the seasonal variation of disturbance in georesistivity. Acta Seismologica Sinica(in Chinese), 1987, 9(3): 289-302. |
| [17] | Lu J, Qian F Y, Zhao Y L. Sensitivity analysis of the Schlumberger monitoring array:application to changes of resistivity prior to the 1976 earthquake in Tangshan, China. Tectonophysics, 1999, 238: 397-405. |
| [18] | Sibson R H.Condition for fault-valve behavior.In:Knipe R J, Rutter E H ed.Deformation Mechanisms, Rheology and Tectonics.London:Geological Society, 1990.15-28 Sibson R H.Condition for fault-valve behavior.In:Knipe R J, Rutter E H ed.Deformation Mechanisms, Rheology and Tectonics.London:Geological Society, 1990.15-28 |
| [19] | Park S K, Johnston T R, Morgan F D, et al. Electromagnetic precursors to earthquakes in the ULF band:a review of observations and mechanisms. Rev Geophys, 1993, 31(2): 117-132. DOI:10.1029/93RG00820 |
| [20] | Byerlee J. Model for episodic of high-pressure water in fault zones before earthquakes. Geology, 1993, 21: 303-306. DOI:10.1130/0091-7613(1993)021 |
| [21] | Nur A. The study of relations between deformation and forces in the Earth.Proceedings of the Third Congress of the International Society for Rock Mechanics, Theme 2:Tectonophysics. Denver, 1974: 243-317. |
| [22] | Madden T R. Electrical measurement as stress-strain monitors.Proceedings of Conference Ⅶ, Stress and Strain Measurements Related to Earthquake Prediction. USGS Open File Rep, 1978: 301-374. |
| [23] | Brace W F, Walsh J B, Frangos W F. Permeability of granite under high pressure. J Geophys Res, 1968, 73(6): 2225-2236. DOI:10.1029/JB073i006p02225 |
| [24] | Morrow C, Brace W F. Electrical resistivity changes in tuffs due to stress. J Geophys Res, 1981, 86: 2929-2934. DOI:10.1029/JB086iB04p02929 |
| [25] | Wang C Y. Electrical resistivity changes in during frictional sliding and fracture. Pure Appl Geophys, 1978, 116(4-5): 717-731. DOI:10.1007/BF00876534 |
| [26] | Fitterman D V. Theory of electrokinetic-magnetic anomalies in a faulted half space. J Geophys Res, 1979, 84: 6031-6040. DOI:10.1029/JB084iB11p06031 |
| [27] | Fenoglio M A, Johston M J S, Byelee J D. Magnetic and electric fields associated with changes in high pore pressure in fault sources:application to the Lama Prieta ULF emissions. J Geophys Res, 1995, 100(B7): 12951-12958. DOI:10.1029/95JB00076 |
| [28] | Corwin R F, Morrison H F. Self-potential variations preceding earthquakes in central California. Geophys Res Lett, 1977, 4: 171-174. DOI:10.1029/GL004i004p00171 |
| [29] | Mizutani H. Electrokinetic phenomena associated with earthquakes. Geophys Res Lett, 1976, 3(7): 365-368. DOI:10.1029/GL003i007p00365 |
| [30] | Sobolev G A. Application of electric method to the tentative short-term forecast of Kamchatka earthquake. Pure Appl Geophys, 1975, 113: 229-235. DOI:10.1007/BF01592913 |
| [31] | Varotsos P, Alexpooulo K. Physical properties of the variations of the electric field of the Earth preceding earthquakes. Tectonophysics, 1984, 110: 73-98. DOI:10.1016/0040-1951(84)90059-3 |
| [32] |
方崇智, 萧德云.
过程辨识. 北京: 清华大学出版社, 1998.
Fang C Z, Xiao D Y. Process Identification (in Chinese)(in Chinese). Beijing: Tsinghua University Press, 1998. |
| [33] | Morse P M, Ingerd K U. Theoretical Acoustics. New York: McGraw Hill, 1968. |
| [34] |
陈颙.
地壳岩石的力学性能--理论基础与实验方法. 北京: 地震出版社, 1988.
Chen Y. Mechanical Properties of Crust Rocks (Basic Theory and Experimental Techniques) (in Chinese)(in Chinese). Beijing: Seismological Press, 1988. |
| [35] | Jaeger J C, Cook N G W. Fundamentals of Rock Mechanics. (Third Edition). London: Chapmen and Hall, 1979. |
| [36] | Zhao Y L, Qian F Y, Yang T C, et al. Experiments in situ of electrical resistivity changes. Acta Seismologica Sinica, 1983, 5(2): 217-225. |
| [37] |
赵玉林, 钱复业, 许同春.
岩土层受力时电阻率变化与应变的关系. 地震学报, 1990, 12(1): 87–93.
Zhao Y L, Qian F Y, Xu T C. The relationship between resistivity variation and strain in load-bearing rock-soil layer. Acta Seismologica Sinica(in Chinese), 1990, 12(1): 87-93. |
| [38] | Zhao Y L, Qian F Y, Stopinskiw W. In situ experiments and relationship between the electrical resistivity changes and the strain. Acta Geophysica Polonica, 1990, 38(3): 229-243. |
| [39] | Qian F Y, Zhao Y L, Huang Y N. Calculation of the parameters of georesistivity anisotropy and case history of earthquake precursors. Acta Seismologica Sinica, 1996, 9(4): 617-627. DOI:10.1007/BF02651052 |
| [40] |
郭增建, 秦保燕, 徐文耀, 等.
震源孕育模式的初步探讨. 地球物理学报, 1973, 16: 43–48.
Kuo T K, Chin P Y, Hsu W Y, et al. Preliminary study on a model for the development of the focus of an earthquake. Acta Geophysica Sinica (in Chinese)(in Chinese), 1973, 16: 43-48. |
| [41] | Zhang Y, Feng W P, Xu L S, et al. Spatial-temporal rupture process of the 2008 great Wenchuan earthquake. Sci China Ser D-Earth Sci, 2009, 52(2): 1-10. |
| [42] |
赵玉林, 卢军, 张洪魁, 等.
电测量在中国地震预报中的应用. 地震地质, 2001, 23(2): 277–285.
Zhao Y L, Lu J, Zhang H K, et al. The application of electrical measurements to earthquake prediction in China. Seismology and Geology(in Chinese), 2001, 23(2): 277-285. |
| [43] | Zhao Y L, Li Z N, Qian F Y, et al. Synthetic criterion for judging the transition geoelectric precursors from medium-term stage to short-term/imminent stage. Journal of Earthquake Prediction Research, 1996, 5(4): 594-601. |
| [44] |
钱复业, 赵玉林.
地电场短临预报方法研究. 地震, 2005, 25(2): 33–40.
Qian F Y, Zhao Y L. Study on geoelectric field method for short-term and impending earthquake prediction. Earthquake (in Chinese with English Abstract)(in Chinese), 2005, 25(2): 33-40. |
| [45] |
钱复业, 赵玉林, 刘捷, 等.
唐山7.8级地震地电阻率临震功率谱异常. 地震, 1990(3): 33–38.
Qian F Y, Zhao Y L, Liu J, et al. Power spectrum anomaly of earth resistivity immediately before Tangshan earthquake M7.8. Earthquake(in Chinese), 1990(3): 33-38. |
| [46] |
钱复业, 赵玉林, 赵耀臣, 等.
地电短临前兆产生机理及一种新的短临预报方法(谐振预报法). 华北地震科学, 1996, 14(3): 1–9.
Qian F Y, Zhao Y L, Zhao Y C, et al. Mechanism for generation of geoelectric precursors and a new method of short-term or impending earthquake prediction:resonance. North China Earthquake Science(in Chinese), 1996, 14(3): 1-9. |
| [47] |
张洪魁.
地电幕式变化及其与地震的关系. 石油地球物理勘探, 2004, 39(Suppl): 90–95.
Zhang H K. Sequence variation of geoelectric data and its correlation to earthquakes. Oil Geophys Prospect(in Chinese), 2004, 39(Suppl): 90-95. |
| [48] |
黄清华, 刘涛.
新岛台地电场的潮汐响应与地震. 地球物理学报, 2006, 46(6): 1745–1754.
Huang Q H, Liu T. Earthquakes and tide response of geoelectric potential field at the Niijima station. Chinese J Geophys(in Chinese), 2006, 46(6): 1745-1754. |
| [49] | Huang Q. Seismicity changes prior to the Ms8.0 Wenchuan earthquake in Sichuan, China. Geophys Res Lett, 2008, 35: L23308. DOI:10.1029/2008GL036270 |
| [50] | Zhao G Z, Chen X B, Wang L F, et al. Evidence of crustal 'channel flow' in the eastern margin of Tibetan Plateau from MT measurements. Chinese Science Bulletin, 2008, 53(12): 1887-1893. |
| [51] |
赵国泽, 陈小斌, 肖骑彬, 等.
汶川M_s8.0级地震成因三"层次"分析-基于深部电性结构. 地球物理学报, 2009, 52(2): 553–563.
Zhao G Z, Chen X B, Xiao Q B, et al. Generation mechanism of Wenchuan strong earthquake of M_s8.0 inferred from Emmeasurements in three levels. Chinese J Geophys(in Chinese), 2009, 52(2): 553-563. |
| [52] |
赵国泽, 陆建勋.
利用人工源超低频电磁波监测地震的试验和分析. 中国工程科学, 2003, 5(10): 27–33.
Zhao G Z, Lu J X. Monitoring and analysis of earthquake phenomena by artificial SLF waves. Engineering Science(in Chinese), 2003, 5(10): 27-33. |
| [53] | Huang Q. Controlled analogue experiments on propagation of seismic electromagnetic signals. Chinese Science Bulletin, 2005, 50(17): 1956-1961. DOI:10.1360/982004-312 |
| [54] | Huang Q. One possible generation mechanism of co-seismic electric signals. Proceedings of the Japan Academy, 2002, 78(7): 173-178. DOI:10.2183/pjab.78.173 |
| [55] | Du A, Huang Q, Yang S. Epicenter location by abnormal ULF electromagnetic emissions. Geophys Res Lett, 2002, 29(10): 1455. DOI:10.1029/2001GL013616 |
| [56] | Huang Q, Ikeya M. Seismic electromagnetic signals (SEMS) explained by a simulation experiment using electromagnetic waves. Physics of the Earth and Planetary Interiors, 1998, 109(3-4): 107-114. DOI:10.1016/S0031-9201(98)00135-6 |
| [57] | Huang Q, Ikeya M. Experimental study on the propagation of seismic electromagnetic signals (SEMS) using a mini-geographic model of the Taiwan strait. Episodes, 1999, 22(4): 289-294. |
| [58] |
钱复业, 卢振业, 丁鉴海, 等.
电磁学分析预报方法. 北京: 地震出版社, 1998.
Qian F Y, Lu Z Y, Ding J H, et al. Analysis and Prediction Methods of Geo-electricity and Geo-magnetic(in Chinese). Beijing: Seismological Press, 1998. |
| [59] |
钱复业, 赵玉林, 陈英方.
地震预测-地电方法论文集. 福州: 福建科学技术出版社, 1985.
Qian F Y, Zhao Y L, Chen Y F. Collect Works of Earthquake Prediction-Geoelectric Methods(in Chinese). Fuzhou: Science and Technology Press of Fujian, 1985. |